Page 133 - Bruno Linder Elementary Physical Chemistry
P. 133

August 18, 2010 11:37      9in x 6in     b985-ch11     Elementary Physical Chemistry


                               118                   Elementary Physical Chemistry


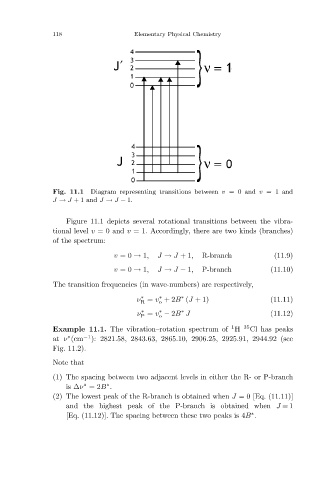
                                         Diagram representing transitions between v =0 and v =1 and
                               Fig. 11.1
                               J → J +1 and J → J − 1.

                                  Figure 11.1 depicts several rotational transitions between the vibra-
                               tional level v =0 and v = 1. Accordingly, there are two kinds (branches)
                               of the spectrum:
                                               v =0 → 1,   J → J +1,   R-branch           (11.9)

                                               v =0 → 1,   J → J − 1,  P-branch          (11.10)
                               The transition frequencies (in wave-numbers) are respectively,

                                                                 ∗
                                                     ν = v +2B (J + 1)                   (11.11)
                                                      ∗
                                                           ∗
                                                           o
                                                      R
                                                     ν = v − 2B J                        (11.12)
                                                      ∗
                                                                 ∗
                                                           ∗
                                                           o
                                                      P
                                                                               1
                               Example 11.1. The vibration–rotation spectrum of H  35 Cl has peaks
                               at ν (cm −1 ): 2821.58, 2843.63, 2865.10, 2906.25, 2925.91, 2944.92 (see
                                   ∗
                               Fig. 11.2).
                               Note that
                               (1) The spacing between two adjacent levels in either the R- or P-branch
                                  is ∆ν =2B .
                                       ∗
                                             ∗
                               (2) The lowest peak of the R-branch is obtained when J = 0 [Eq. (11.11)]
                                  and the highest peak of the P-branch is obtained when J =1
                                                                                    ∗
                                  [Eq. (11.12)]. The spacing between these two peaks is 4B .
   128   129   130   131   132   133   134   135   136   137   138