
Page 246 - Elements of Chemical Reaction Engineering 3rd Edition
P. 246
21 8 Isothermal Reactor Design Chap. 4
A
B
A
B
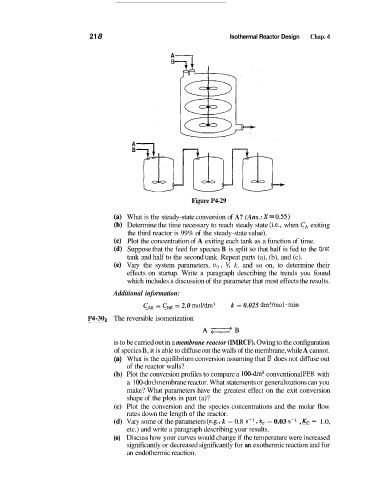
Figure P4-29
What is the steady-state conversion of A? (Ans.: XGO.55)
Determine the time necessary to reach steady state (Le., when C, exiting
the third reactor is 99% of the steady-state value).
Plot the concentration of A exiting each tank as a function of time.
Suppose that the feed for species B is split so that half is fed to the first
tank and half to the second tank. Repeat parts (a), (b), and (c).
Vary the system parameters, v,, V; k, and so on, to determine their
effects on startup. Write a paragraph describing the trends you found
which includes a discussion of the parameter that most effects the results.
Additional information:
C,, = C,, = 2.0 mol/dm3 k = 0.025 dm3/mol.min
P4-30B The reversible isomerization
A ~ B
is to be carried out in a membrane reactor (IMRCF). Owing to the configuration
of species B, it is able to diffuse out the walls of the membrane, while A cannot.
(a) What is the equilibrium conversion assuming that B does not diffuse out
of the reactor walls?
(b) Plot the conversion profiles to compare a 100-dm3 conventional PFR with
a 100-dm3 membrane reactor. What statements or generalizations can you
make? What parameters have the greatest effect on the exit conversion
shape of the plots in part (a)?
(c) Plot the conversion and the species concentrations and the molar flow
rates down the length of the reactor.
(d) Vary some of the parameters (e.g., k = 0.8 s-1, k, = 0.03 s-l , Kc = 1.0,
etc.) and write a paragraph describing your results.
(e) Discuss how your curves would change if the temperature were increased
significantly or decreased significantly for an exothermic reaction and for
an endothermic reaction.