
Page 74 - Elements of Chemical Reaction Engineering 3rd Edition
P. 74
46 Conversion and Reactor Sizing Chap. 2
We can continue in this manner to arrive at Table E2-3.1.
TABLE E2-3.1, CONVERSION PROFILE
V(dm3) 0 33.4 71.6 126 225
X 0 0.2 0.4 0.6 0.8
0.0053 0.005 0.004 0.0025 0.00125
-rA(s)
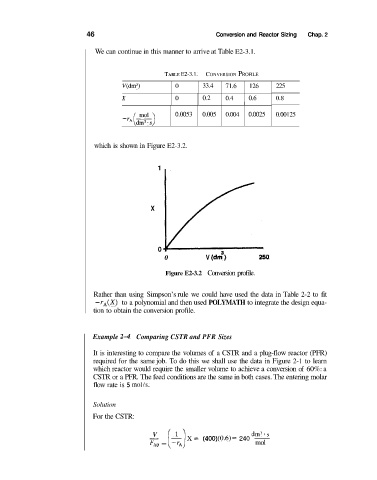
which is shown in Figure E2-3.2.
1
X
0
0 V (d;) 250
Figure E2-3.2 Conversion profile.
Rather than using Simpson’s rule we could have used the data in Table 2-2 to fit
- rA(X) to a polynomial and then used POLYMATH to integrate the design equa-
tion to obtain the conversion profile.
Example 2-4 Comparing CSTR and PFR Sizes
It is interesting to compare the volumes of a CSTR and a plug-flow reactor (PFR)
required for the same job. To do this we shall use the data in Figure 2-1 to learn
which reactor would require the smaller volume to achieve a conversion of 60%: a
CSTR or a PFR. The feed conditions are the same in both cases. The entering molar
flow rate is 5 mol/s.
Solution
For the CSTR:
= [+) mol
V dm3. s
X = (400) (0.6)~ 240 -