Page 423 - Elements of Chemical Reaction Engineering Ebook
P. 423
394                               Nonelementary Reaction Kinetics   Chap. 7

                          catalysts. A  common example of  specificity in bioconversion production  of  a
                          single  desired isomer that when produced chemically yields a mixture of iso-
                          mers  is  the  conversion  of  cis-proenylphosphonic  acid  to  the  antibiotic  (-)
                          cis- 1,2-epoxypropyl-phosphonic acid.
                               In biosynthesis, the cells, also referred to as the biomass, consume nutri-
                          ents to grow and produce more cells and important products. Internally, a cell
                          uses  its  nutrients  to  produce  energy  and  more  cells.  This  transformation  of
                          nutrients to energy and bioproducts  is accomplished through  a cell’s use of  a
                          number  of  different  enzymes  (catalysts)  in  a  series  of  reactions  to  produce
                          metabolic products. These products can either remain in the cell (intracellular)
                          or be secreted from the cells (extracellular). In the former case the cells must
                          be  lysed  (ruptured)  and the  product  purified  from  the  whole  broth  (reaction
                          mixture).
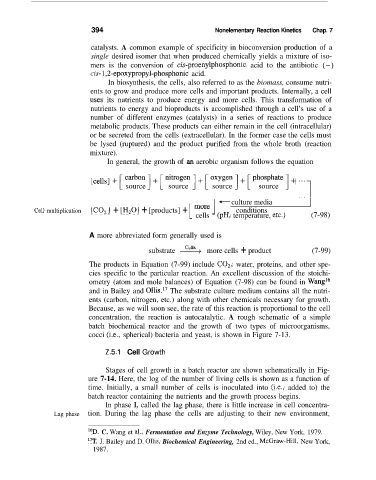
                              In general, the growth of  an aerobic organism follows the equation

                                                                                   “‘1
                                   source      source      source       source

                                                                culture media
           Cell multiplication   [CO,]  + [H20] + [products] +  more   conditions
                                                       cells 1 iH, temperature, etc.)   (7-98)

                         A more abbreviated form generally used is

                                          substrate       more cells + product        (7-99)
                         The products in Equation  (7-99) include COz, water, proteins,  and other spe-
                         cies  specific to the particular reaction. An  excellent discussion of  the  stoichi-
                         ometry (atom and mole balances) of  Equation  (7-98) can be found in Wang16
                         and in Bailey and Ollis.17 The substrate culture medium contains all the nutri-
                         ents (carbon, nitrogen, etc.) along with other chemicals necessary for growth.
                         Because, as we will soon see, the rate of this reaction is proportional to the cell
                         concentration,  the  reaction  is  autocatalytic.  A  rough  schematic  of  a  simple
                         batch  biochemical  reactor  and  the  growth  of  two  types  of  microorganisms,
                         cocci (i.e., spherical) bacteria and yeast, is shown in Figure 7-13.

                              7.5.1  Cell Growth

                              Stages of  cell growth in a batch reactor  are shown schematically in Fig-
                         ure 7-14. Here, the log of the number of living cells is shown as a function of
                         time.  Initially, a  small  number  of  cells  is  inoculated  into  (ie., added  to)  the
                         batch reactor containing the nutrients and the growth process begins.
                              In phase I,  called the lag phase, there is little increase in cell concentra-
                Lag phase   tion. During  the  lag phase  the  cells  are  adjusting  to  their  new  environment,

                         16D. C. Wang et al., Fermentation and Enzyme Technology, Wiley, New York,  1979.
                         17T. J. Bailey and D. Ollis, Biochemical Engineering, 2nd ed., McGraw-Hill, New York,
                          1987.

