
Page 140 - Embedded Microprocessor Systems Real World Design
P. 140
OVERRIDE TIME
WATER LEVEL LOW
PE STATUS
STATUS OF SET
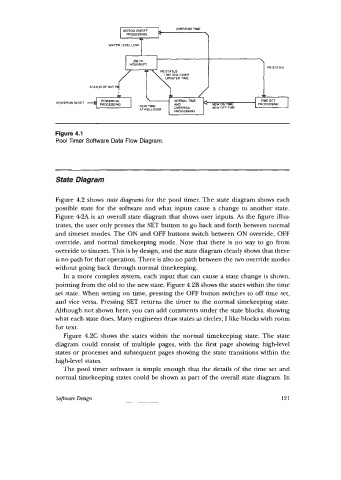
Figure 4.1
Pool Timer Software Data Flow Diagram.
State Diagram
Figure 4.2 shows state diagrams for the pool timer. The state diagram shows each
possible state for the software and what inputs cause a change to another state.
Figure 42A is an overall state diagram that shows user inputs. As the figure illus-
trates, the user only presses the SET button to go back and forth between normal
and timeset modes. The ON and OFF buttons switch between ON override, OFF
override, and normal timekeeping mode. Note that there is no way to go from
override to timeset. This is by design, and the state diagram clearly shows that there
is no path for that operation. There is also no path between the two override modes
without going back through normal timekeeping.
In a more complex system, each input that can cause a state change is shown,
pointing from the old to the new state. Figure 4.2B shows the states within the time
set state. When setting on time, pressing the OFF button switches to off time set,
and vice versa. Pressing SET returns the timer to the normal timekeeping state.
Although not shown here, you can add comment5 under the state blocks, showing
what each state does. Many engineers draw states as circles; I like blocks with room
for text.
Figure 4.2C shows the states within the normal timekeeping state. The state
diagram could consist of multiple pages, with the first page showing high-level
states or processes and subsequent pages showing the state transitions within the
high-level states.
The pool timer software is simple enough that the details of the time set and
normal timekeeping states could be shown as part of the overall state diagram. In
Software Design 121