
Page 239 - Academic Press Encyclopedia of Physical Science and Technology 3rd BioTechnology
P. 239
P1: GTV/GWT P2: GRB/GJP QC: FYDFinal Pages
Encyclopedia of Physical Science and Technology EN011J-559 July 25, 2001 18:57
Pharmacokinetics 817
E. Patients with Liver Disease renal clearance appears to be increased 1 week after the
injury, while hepatic metabolism is quite variable. Poorly
Most data concerning drug elimination in liver disease
extracted drugs may have a significantly decreased hepatic
have been obtained in patients with cirrhosis. Current the-
clearance. Therapeutic drug monitoring is recommended
ories regard the decreased permeability of the hepatic si-
for all critical medications in burn patients.
nusoid as a major feature in the changes brought about
in the liver. Oxidative metabolism is typically impaired in
cirrhosis with the sparing of drug glucuronidation until se- VI. QUANTITATIVE APPROACHES TO
vere impairment occurs. Biliary excretion is also impaired. PHARMACOKINETIC MODELING
Moderate liver impairment decreases the clearance of the
native drug or metabolites from the kidney, often in spite
The goal of pharmacokinetics is the quantitative descrip-
of normal creatinine clearance. Because renal tubular se-
tion of drug entry, distribution, and elimination in the
cretion of creatinine is increased in cirrhosis, creatinine
body. These processes are typically integrated into a math-
clearance may not reflect the actual degree of renal dys-
ematical model which uses a system of equations such as
function. In cases of liver disease without cirrhosis (car-
Eqs. (1)–(20) to calculate the systemic concentration due
cinoma, viral hepatitis), dose changes are probably not
to a certain dose administered to the patient. If the phar-
necessary. In general, chronic liver disease with cirrho-
macodynamic characteristics of the drug can be clearly
sis requires reduction in dose, regardless of the route of
defined, the desired concentration at the target or in the
elimination.
plasma can be specified, and the pharmacokinetic model
can be used to calculate the dose to attain the effective
F. Congestive Heart Failure concentration.
Congestive heart failure includes cardiac “pump” failure
A. Compartmental Approaches
and results in poor perfusion of the liver and kidney. Con-
gestion also occurs in the liver and the gut. Pharmacoki- The classic approach to pharmacokinetic modeling is to
netics is altered in heart failure: the volume of distribution describe the system as a group of arbitrarily sized com-
is reduced and clearance is decreased. The net result of partments with one compartment designated as the cen-
changes is often not predictable, but plasma drug con- tral compartment which receives the drug via some route
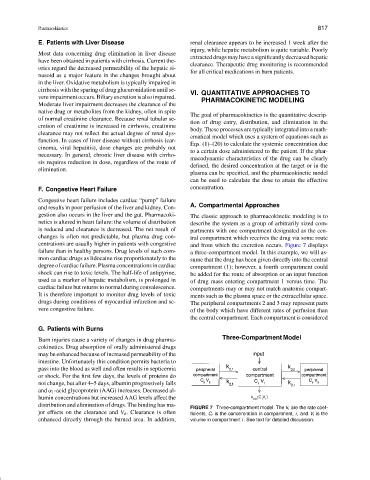
centrations are usually higher in patients with congestive and from which the excretion occurs. Figure 7 displays
failure than in healthy persons. Drug levels of such com- a three-compartment model. In this example, we will as-
mon cardiac drugs as lidocaine rise proportionately to the sume that the drug has been given directly into the central
degree of cardiac failure. Plasma concentrations in cardiac compartment (1); however, a fourth compartment could
shock can rise to toxic levels. The half-life of antipyrine, be added for the route of absorption or an input function
used as a marker of hepatic metabolism, is prolonged in of drug mass entering compartment 1 versus time. The
cardiac failure but returns to normal during convalescence. compartments may or may not match anatomic compart-
It is therefore important to monitor drug levels of toxic ments such as the plasma space or the extracellular space.
drugs during conditions of myocardial infarction and se- The peripheral compartments 2 and 3 may represent parts
vere congestive failure. of the body which have different rates of perfusion than
the central compartment. Each compartment is considered
G. Patients with Burns
Burn injuries cause a variety of changes in drug pharma-
cokinetics. Drug absorption of orally administered drugs
may be enhanced because of increased permeability of the
intestine. Unfortunately this condition permits bacteria to
pass into the blood as well and often results in septicemia
or shock. For the first few days, the levels of proteins do
not change, but after 4–5 days, albumin progressively falls
and α 1 -acid glycoprotein (AAG) increases. Decreased al-
bumin concentrations but increased AAG levels affect the
distribution and elimination of drugs. The binding has ma-
FIGURE 7 Three-compartment model. The k i are the rate coef-
jor effects on the clearance and V d . Clearance is often ficients, C i is the concentration in compartment, i , and V i is the
enhanced directly through the burned area. In addition, volume in compartment i . See text for detailed discussion.