
Page 179 - Academic Press Encyclopedia of Physical Science and Technology 3rd Analytical Chemistry
P. 179
P1: GQT Final
Encyclopedia of Physical Science and Technology EN006F-275 June 29, 2001 21:12
470 Gas Chromatography
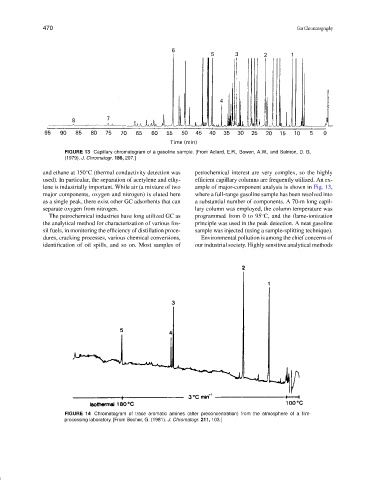
FIGURE 13 Capillary chromatogram of a gasoline sample. [From Adlard, E.R., Bowen, A.W., and Salmon, D. G.
(1979). J. Chromatogr. 186, 207.]
and ethane at 150 C (thermal conductivity detection was petrochemical interest are very complex, so the highly
◦
used). In particular, the separation of acetylene and ethy- efficient capillary columns are frequently utilized. An ex-
lene is industrially important. While air (a mixture of two ample of major-component analysis is shown in Fig. 13,
major components, oxygen and nitrogen) is eluted here where a full-range gasoline sample has been resolved into
as a single peak, there exist other GC adsorbents that can a substantial number of components. A 70-m long capil-
separate oxygen from nitrogen. lary column was employed, the column temperature was
The petrochemical industries have long utilized GC as programmed from 0 to 95 C, and the flame-ionization
◦
the analytical method for characterization of various fos- principle was used in the peak detection. A neat gasoline
sil fuels, in monitoring the efficiency of distillation proce- sample was injected (using a sample-splitting technique).
dures, cracking processes, various chemical conversions, Environmental pollution is among the chief concerns of
identification of oil spills, and so on. Most samples of our industrial society. Highly sensitive analytical methods
FIGURE 14 Chromatogram of trace aromatic amines (after preconcentration) from the atmosphere of a film-
processing laboratory. [From Becher, G. (1981). J. Chromatogr. 211, 103.]