
Page 377 - Academic Press Encyclopedia of Physical Science and Technology 3rd Analytical Chemistry
P. 377
P1: LLL/LOS/GJM P2: GLM Final Pages
Encyclopedia of Physical Science and Technology EN0011A-541 July 25, 2001 17:27
480 Organic Chemistry, Compound Detection
FTIR permits rapid quantitative characterization of solids, tion in a flow cell is very difficult. For normal-phase and
liquids, and gases. reverse-phase HPLC, continuous elimination of the sol-
Kinetic processes can be monitored by a technique vent is usually required before identifiable IR spectra can
known as time-resolved spectroscopy which involves be measured; no commercial instruments are yet available.
FTIR. This method has been applied to analysis of com- For at least one of these systems, a detection limit of 100
plex materials such as polymer film stretching which can ng has been reported for reverse-phase separations with a
be carried out in milliseconds and chemical transforma- water–methanol mobile phase.
tions involving, for example, coal pyrolysis; it also permits In conventional HPLC–FTIR, the interferograms are
on line analysis of products subject to chromatographic continuously recorded and stored during the analysis.
separation methods such as GC and LC. During the past Next, the absorption bands due to the solvent are sub-
five years GC–IR and GC–FTIR involved separating of tractedfromthesolutionspectra.Inordertofacilitatethese
mixtures and analysis of the individual compounds by IR measurements, the volume of the flow cell must be of the
spectroscopy. The sensitivity limitation of IR detectors order of 1 µL, implying that even with the packings of
with respect to GC and the time difference between the 3–5 µm diameter, the evolution volumes will be signif-
elution of a GC peak (measured in seconds) and the time icantly higher than the cell volume. Thus, only a small
scan were two of the problems encountered. GC–FTIR fraction (less than 1%) of each separated component will
allows an IR spectrum taken from a 5-µg GC peak of be in the cell when the measurements are made. Of the sev-
isobutylmethacrylate by repeatedly scanning with spectral eral interfaces proposed for solvent elimination, the most
accumulation and enhancement (Fig. 8). FTIR measure- promising one involves an initial concentration step in the
ments may be carried out by one of the following tech- concentrator tube using N 2 gas and above ambient tem-
niques: (a) KBr pellets, (b) photoacoustic, and (c) diffuse perature, followed by the deposition of the concentrated
reflectance methods. solution on the KCl powder. Further elimination of the
The rapid-scanning property of FTIR spectrometers is solvent is achieved with a stream of air.
having its greatest impact in the field of GC–FTIR. FTIR
is now rivaling mass spectrometry for the identification
1. Diffuse Reflectance Fourier Transform
of unknowns eluting from gas chromatographs and in one
Spectrometry (DRIFTS)
study was shown to identify more peaks than MS. It is
clear that GC–FTIR will be of importance for the analysis Diffuse reflectance Fourier transform spectrometry
of environmental samples. The interface between FTIR (DRIFTS) is a multifaceted technique for studying solid
and HPLC is still at a premature stage, and most of the samples. Diffuse reflectance has been known for some
HPLC–FTIR results reported to date have involved the use time as a solid sampling method. When infrared radia-
of size-exclusion chromatography with chlorinated sol- tion falls onto a sample surface, one of the following pro-
vents, since these have good transmission over much of cesses can occur. (a) The radiation can be absorbed; (b)
the infrared. The maximum concentration of most peaks it can be reflected from the sample (specular reflectance);
eluting from either normal-phase or reverse-phase HPLC or (c) it can penetrate the sample before being scattered
columns rarely exceeds 10 ppm, so that on-line detec- (Fig. 9). This latter effect is known as diffuse reflectance,
and it is this radiation that the technique of DRIFTS mea-
sures. The technique is applicable to most solids, involves
very little sample preparation, and avoids the unnecessary
complications of absorptions due to solvents or mulling
agents. Its greatest advantage by far, however, is its ability
to handle a wide range of samples, including conventional
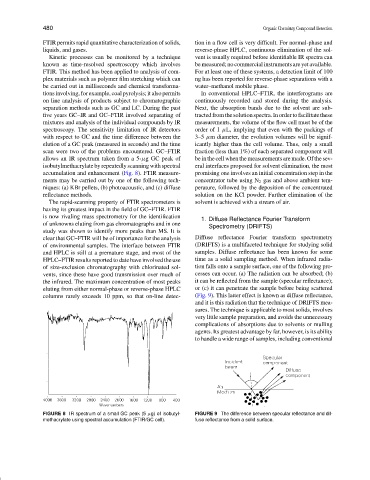
FIGURE 8 IR spectrum of a small GC peak (5 µg) of isobutyl- FIGURE 9 The difference between specular reflectance and dif-
methacrylate using spectral accumulation (FTIR/GC cell). fuse reflectance from a solid surface.