
Page 379 - Academic Press Encyclopedia of Physical Science and Technology 3rd Analytical Chemistry
P. 379
P1: LLL/LOS/GJM P2: GLM Final Pages
Encyclopedia of Physical Science and Technology EN0011A-541 July 25, 2001 17:27
482 Organic Chemistry, Compound Detection
a. Analytical applications using GC–MI-FTIR. If
GC–MI-FTIR spectrometry is to become a useful analyt-
ical tool for the identification of unknown components in
complex organic mixtures, matrix effects on the appear-
ance of FTIR spectra must be well characterized. The re-
quirements of using GC–MI-FTIR for analytical analyses
are:
1. The spectra of individual compounds must have nar-
row bandwidths and high resolution.
2. The FTIR spectrum of each compound must be
unique, conclusive, and relatively simple.
3. The spectral features for a given compound must be
reproducible from sample to sample.
4. The molar absorptivity of the compound must be
independent of concentration and not be affected signifi-
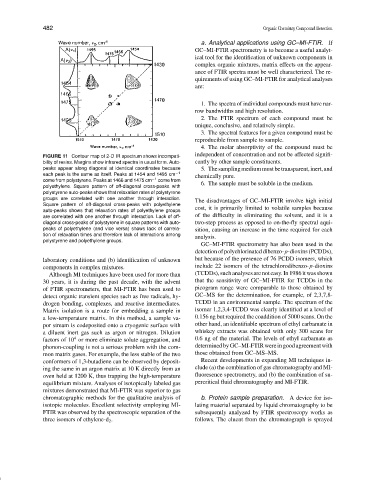
FIGURE 11 Contour map of 2-D IR spectrum shows incompati-
bility of resins. Margins show infrared spectra in usual form. Auto- cantly by other sample constituents.
peaks appear along diagonal at identical coordinates because 5. Thesamplingmediummustbetransparent,inert,and
each peak is the same as itself. Peaks at 1454 and 1495 cm −1 chemically pure.
come from polystyrene. Peaks at 1466 and 1475 cm −1 come from
polyethylene. Square pattern of off-diagonal cross-peaks with 6. The sample must be soluble in the medium.
polystyrene auto-peaks shows that relaxation rates of polystyrene
groups are correlated with one another through interaction. The disadvantages of GC–MI-FTIR involve high initial
Square pattern of off-diagonal cross-peaks with polyethylene
auto-peaks shows that relaxation rates of polyethylene groups cost, it is primarily limited to volatile samples because
are correlated with one another through interaction. Lack of off- of the difficulty in eliminating the solvent, and it is a
diagonal cross-peaks of polystyrene in square patterns with auto- two-step process as opposed to on-the-fly spectral aqui-
peaks of polyethylene (and vice versa) shows lack of correla- sition, causing an increase in the time required for each
tion of relaxation times and therefore lack of interactions among analysis.
polystyrene and polyethylene groups.
GC–MI-FTIR spectrometry has also been used in the
detection of polychlorinated dibenzo-p-dioxins (PCDDs),
laboratory conditions and (b) identification of unknown but because of the presence of 76 PCDD isomers, which
components in complex mixtures. include 22 isomers of the tetrachlorodibenzo-p-dioxins
Although MI techniques have been used for more than (TCDDs), such analyses are not easy. In 1986 it was shown
30 years, it is during the past decade, with the advent that the sensitivity of GC–MI-FTIR for TCDDs in the
of FTIR spectrometers, that MI-FTIR has been used to picogram range were comparable to those obtained by
detect organic transient species such as free radicals, hy- GC–MS for the determination, for example, of 2,3,7,8-
drogen bonding, complexes, and reactive intermediates. TCDD in an environmental sample. The spectrum of the
Matrix isolation is a route for embedding a sample in isomer 1,2,3,4-TCDD was clearly identified at a level of
a low-temperature matrix. In this method, a sample va- 0.156 ng but required the coaddition of 5000 scans. On the
por stream is codeposited onto a cryogenic surface with other hand, an identifiable spectrum of ethyl carbamate in
a diluent inert gas such as argon or nitrogen. Dilution whiskey extracts was obtained with only 300 scans for
4
factors of 10 or more eliminate solute aggregation, and 0.6 ng of the material. The levels of ethyl carbamate as
phonon-coupling is not a serious problem with the com- determinedbyGC–MI-FTIRwereingoodagreementwith
mon matrix gases. For example, the less stable of the two those obtained from GC–MS–MS.
conformers of 1,3-butadiene can be observed by deposit- Recent developments in expanding MI techniques in-
ing the same in an argon matrix at 10 K directly from an clude (a) the combination of gas chromatography and MI-
oven held at 1200 K, thus trapping the high-temperature fluoresence spectrometry, and (b) the combination of su-
equilibrium mixture. Analyses of isotopically labeled gas percritical fluid chromatography and MI-FTIR.
mixtures demonstrated that MI-FTIR was superior to gas
chromatographic methods for the qualitative analysis of b. Protein sample preparation. A device for iso-
isotopic molecules. Excellent selectivity employing MI- lating material separated by liquid chromatography to be
FTIR was observed by the spectroscopic separation of the subsequently analyzed by FTIR spectroscopy works as
three isomers of ethylene-d 2 . follows. The eluent from the chromatograph is sprayed