
Page 147 - Academic Press Encyclopedia of Physical Science and Technology 3rd BioChemistry
P. 147
P1: LDK/GLT P2: GRB Final pages
Encyclopedia of Physical Science and Technology EN013H-614 July 27, 2001 10:29
Protein Folding 187
of a protein. This spectral responsiveness is in terms of
its emission maximum and its quantum yield. For ex-
ample, the emission maximum of tryptophan almost al-
ways shifts to longer wavelengths (red shifts) upon un-
folding a protein and increasing the solvent exposure
of this amino acid side chain. There is a large litera-
ture about the fluorescence of tryptophan residues in pro-
teins and its use to study changes in the structure of
proteins. 19
A variety of extrinsic fluorophores can be attached to
proteins to serve as fluorescence probes. These can be se-
lected to maximize sensitivity and to avoid contamination
(i.e., by moving to longer absorption and emission wave-
lengths) from other absorbing components. 22 With both
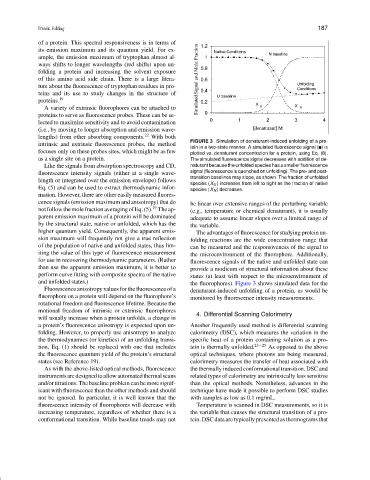
FIGURE 3 Simulation of denaturant-induced unfolding of a pro-
intrinsic and extrinsic fluorescence probes, the method
tein in a two-state manner. A simulated fluorescence signal ( ) is
focuses only on these probes sites, which might be as few plotted vs. denaturant concentration for a protein, using Eq. (8).
as a single site on a protein. The simulated fluorescence signal decreases with addition of de-
Like the signals from absorption spectroscopy and CD, naturant because the unfolded species has a smaller fluorescence
fluorescence intensity signals (either at a single wave- signal (fluorescence is quenched on unfolding). The pre- and post-
transition baselines may slope, as shown. The fraction of unfolded
length or integrated over the emission envelope) follows
species (X U ) increases from left to right as the fraction of native
Eq. (5) and can be used to extract thermodynamic infor- species (X N ) decreases.
mation. However, there are other easily measured fluores-
cence signals (emission maximum and anisotropy) that do be linear over extensive ranges of the perturbing variable
19
not follow the mole fraction averaging of Eq. (5). The ap- (e.g., temperature or chemical denaturant), it is usually
parent emission maximum of a protein will be dominated adequate to assume linear slopes over a limited range of
by the structural state, native or unfolded, which has the the variable.
higher quantum yield. Consequently, the apparent emis- The advantages of fluorescence for studying protein un-
sion maximum will frequently not give a true reflection folding reactions are the wide concentration range that
of the population of native and unfolded states, thus lim- can be measured and the responsiveness of the signal to
iting the value of this type of fluorescence measurement the microenvironment of the fluorophore. Additionally,
for use in recovering thermodynamic parameters. (Rather fluorescence signals of the native and unfolded state can
than use the apparent emission maximum, it is better to provide a modicum of structural information about these
perform curve fitting with composite spectra of the native states (at least with respect to the microenvironment of
and unfolded states.) the fluorophores). Figure 3 shows simulated data for the
Fluorescence anisotropy values for the fluorescence of a denaturant-induced unfolding of a protein, as would be
fluorophore on a protein will depend on the fluorophore’s monitored by fluorescence intensity measurements.
rotational freedom and fluorescence lifetime. Because the
motional freedom of intrinsic or extrinsic fluorophores
4. Differential Scanning Calorimetry
will usually increase when a protein unfolds, a change in
a protein’s fluorescence anisotropy is expected upon un- Another frequently used method is differential scanning
folding. However, to properly use anisotropy to analyze calorimetry (DSC), which measures the variation in the
the thermodynamics (or kinetics) of an unfolding transi- specific heat of a protein containing solution as a pro-
tion, Eq. (1) should be replaced with one that includes tein is thermally unfolded. 23−25 As opposed to the above
the fluorescence quantum yield of the protein’s structural optical techniques, where photons are being measured,
states (see Reference 19). calorimetry measures the transfer of heat associated with
As with the above-listed optical methods, fluorescence the thermally induced conformational transition. DSC and
instrumentsaredesignedtoallowautomatedthermalscans related types of calorimetry are intrinsically less sensitive
and/or titrations. The baseline problem can be more signif- than the optical methods. Nonetheless, advances in the
icant with fluorescence than the other methods and should technique have made it possible to perform DSC studies
not be ignored. In particular, it is well known that the with samples as low as 0.1 mg/mL.
fluorescence intensity of fluorophores will decrease with Temperature is scanned in DSC measurements, so it is
increasing temperature, regardless of whether there is a the variable that causes the structural transition of a pro-
conformational transition. While baseline trends may not tein. DSC data are typically presented as thermograms that