
Page 146 - Academic Press Encyclopedia of Physical Science and Technology 3rd BioChemistry
P. 146
P1: LDK/GLT P2: GRB Final pages
Encyclopedia of Physical Science and Technology EN013H-614 July 27, 2001 10:29
186 Protein Folding
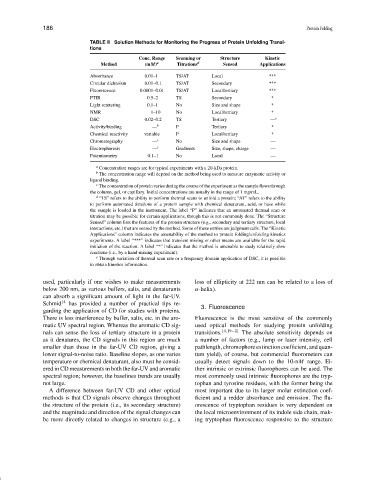
TABLE II Solution Methods for Monitoring the Progress of Protein Unfolding Transi-
tions
Conc. Range Scanning or Structure Kinetic
Method (mM) a Titrations d Sensed Applications
Absorbance 0.01–1 TS/AT Local ***
Circular dichroism 0.01–0.1 TS/AT Secondary ***
Fluorescence 0.0001–0.01 TS/AT Local/tertiary ***
FTIR 0.5–2 TS Secondary *
Light scattering 0.1–1 No Size and shape *
NMR 1–10 No Local/tertiary *
DSC 0.02–0.2 TS Tertiary — e
Activity/binding — b P Tertiary *
Chemical reactivity variable P Local/tertiary *
Chromatography — c No Size and shape —
Electrophoresis — c Gradients Size, shape, charge —
Potentiometry 0.1–1 No Local —
a Concentration ranges are for typical experiments with a 20-kDa protein.
b The concentration range will depend on the method being used to measure enzymatic activity or
ligand binding.
c The concentration of protein varies during the course of the experiment as the sample flows through
the column, gel, or capillary. Initial concentrations are usually in the range of 1 mg/mL.
d
“TS” refers to the ability to perform thermal scans to unfold a protein; “AT” refers to the ability
to perform automated titrations of a protein sample with chemical denaturant, acid, or base while
the sample is loaded in the instrument. The label “P” indicates that an automated thermal scan or
titration may be possible for certain applications, though this is not commonly done. The “Structure
Sensed” column lists the features of the protein structure (e.g., secondary and tertiary structure, local
interactions, etc.) that are sensed by the method. Some of these entries are judgment calls. The “Kinetic
Applications” column indicates the amenability of the method to protein folding/unfolding kinetics
experiments. A label “***” indicates that transient mixing or other means are available for the rapid
initiation of the reaction. A label “*” indicates that the method is amenable to study relatively slow
reactions (i.e., by a hand-mixing experiment).
e Through variation of thermal scan rate or a frequency domain application of DSC, it is possible
to obtain kinetics information.
used, particularly if one wishes to make measurements loss of ellipticity at 222 nm can be related to a loss of
below 200 nm, as various buffers, salts, and denaturants α-helix).
can absorb a significant amount of light in the far-UV.
Schmid 14 has provided a number of practical tips re-
3. Fluorescence
garding the application of CD for studies with proteins.
There is less interference by buffer, salts, etc. in the aro- Fluorescence is the most sensitive of the commonly
matic UV spectral region. Whereas the aromatic CD sig- used optical methods for studying protein unfolding
nals can sense the loss of tertiary structure in a protein transitions. 14,19−21 The absolute sensitivity depends on
as it denatures, the CD signals in this region are much a number of factors (e.g., lamp or laser intensity, cell
smaller than those in the far-UV CD region, giving a pathlength, chromophore extinction coefficient, and quan-
lower signal-to-noise ratio. Baseline slopes, as one varies tum yield), of course, but commercial fluorometers can
temperature or chemical denaturant, also must be consid- usually detect signals down to the 10-nM range. Ei-
ered in CD measurements in both the far-UV and aromatic ther intrinsic or extrinsic fluorophores can be used. The
spectral region; however, the baselines trends are usually most commonly used intrinsic fluorophores are the tryp-
not large. tophan and tyrosine residues, with the former being the
A difference between far-UV CD and other optical most important due to its larger molar extinction coef-
methods is that CD signals observe changes throughout ficient and a redder absorbance and emission. The flu-
the structure of the protein (i.e., its secondary structure) orescence of tryptophan residues is very dependent on
and the magnitude and direction of the signal changes can the local microenvironment of its indole side chain, mak-
be more directly related to changes in structure (e.g., a ing tryptophan fluorescence responsive to the structure