
Page 325 - Academic Press Encyclopedia of Physical Science and Technology 3rd InOrganic Chemistry
P. 325
P1: GPA Final Pages
Encyclopedia of Physical Science and Technology EN010b-481 July 14, 2001 18:45
Noble Metals (Chemistry) 479
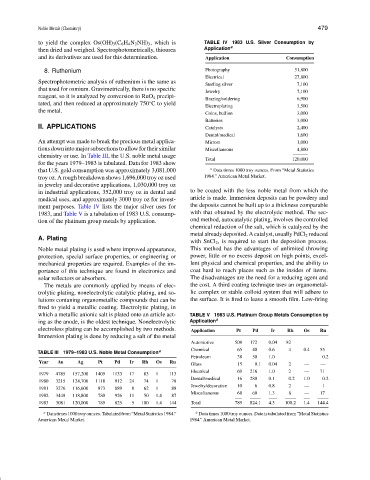
to yield the complex Os(OH) 3 (C 6 H 4 N 2 NH) 3 , which is TABLE IV 1983 U.S. Silver Consumption by
then dried and weighed. Spectrophotometrically, thiourea Application a
and its derivatives are used for this determination. Application Consumption
8. Ruthenium Photography 51,800
Electrical 27,800
Spectrophotometric analysis of ruthenium is the same as
Sterling silver 7,100
that used for osmium. Gravimetrically, there is no specific
Jewelry 7,100
reagent, so it is analyzed by conversion to RuO 4 precipi-
Brazing/soldering 6,900
◦
tated, and then reduced at approximately 750 C to yield
Electroplating 3,500
the metal.
Coins, bullion 3,000
Batteries 3,000
II. APPLICATIONS Catalysts 2,400
Dental/medical 1,600
An attempt was made to break the precious metal applica- Mirrors 1,000
tions down into major subsections to allow for their similar Miscellaneous 4,800
chemistry or use. In Table III, the U.S. noble metal usage
Total 120,000
for the years 1979–1983 is tabulated. Data for 1983 show
that U.S. gold consumption was approximately 3,081,000 a Data times 1000 troy ounces. From “Metal Statistics
troy oz. A rough breakdown shows 1,696,000 troy oz used 1984.” American Metal Market.
in jewelry and decorative applications, 1,030,000 troy oz
in industrial applications, 352,000 troy oz in dental and to be coated with the less noble metal from which the
medical uses, and approximately 3000 troy oz for invest- article is made. Immersion deposits can be powdery and
ment purposes. Table IV lists the major silver uses for the deposits cannot be built up to a thickness comparable
1983, and Table V is a tabulation of 1983 U.S. consump- with that obtained by the electrolytic method. The sec-
tion of the platinum group metals by application. ond method, autocatalytic plating, involves the controlled
chemical reduction of the salt, which is catalyzed by the
metal already deposited. A catalyst, usually PdCl 2 reduced
A. Plating
with SnCl 2 , is required to start the deposition process.
Noble metal plating is used where improved appearance, This method has the advantages of unlimited throwing
protection, special surface properties, or engineering or power, little or no excess deposit on high points, excel-
mechanical properties are required. Examples of the im- lent physical and chemical properties, and the ability to
portance of this technique are found in electronics and coat hard to reach places such as the insides of items.
solar reflectors or absorbers. The disadvantages are the need for a reducing agent and
The metals are commonly applied by means of elec- the cost. A third coating technique uses an organometal-
trolytic plating, nonelectrolytic catalytic plating, and so- lic complex or stable colloid system that will adhere to
lutions contaning organometallic compounds that can be the surface. It is fired to leave a smooth film. Low-firing
fired to yield a metallic coating. Electrolytic plating, in
which a metallic anionic salt is plated onto an article act- TABLE V 1983 U.S. Platinum Group Metals Consumption by
ing as the anode, is the oldest technique. Nonelectrolytic Application a
electroless plating can be accomplished by two methods. Application Pt Pd Ir Rh Os Ru
Immersion plating is done by reducing a salt of the metal
Automotive 508 172 0.04 82 — —
Chemical 65 40 0.6 4 0.4 55
TABLE III 1979–1983 U.S. Noble Metal Consumption a
Petroleum 38 50 1.0 — — 0.2
Year Au Ag Pt Pd Ir Rh Os Ru
Glass 15 0.1 0.04 2 — —
Electrical 69 216 1.0 2 — 71
1979 4785 157,200 1409 1133 17 83 1 113
Dental/medical 16 280 0.1 0.2 1.0 0.2
1980 3215 124,700 1118 912 24 74 1 78
Jewelry/decorative 10 6 0.8 2 — 1
1981 3276 116,600 873 889 8 62 1 88
Miscellaneous 68 60 1.3 8 — 17
1982 3448 118,800 780 926 11 50 1.4 87
1983 3081 120,000 789 825 5 100 1.4 144 Total 789 824.1 4.3 100.2 1.4 144.4
a a
Datatimes1000troyounces.Tabulatedfrom“MetalStatistics1984.” Data times 1000 troy ounces. Data is tabulated from “Metal Statistics
American Metal Market. 1984.” American Metal Market.