
Page 121 - Enhanced Oil Recovery in Shale and Tight Reservoirs
P. 121
108 Enhanced Oil Recovery in Shale and Tight Reservoirs
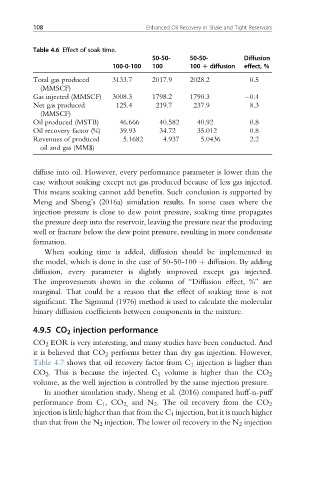
Table 4.6 Effect of soak time.
50-50- 50-50- Diffusion
100-0-100 100 100 D diffusion effect, %
Total gas produced 3133.7 2017.9 2028.2 0.5
(MMSCF)
Gas injected (MMSCF) 3008.3 1798.2 1790.3 0.4
Net gas produced 125.4 219.7 237.9 8.3
(MMSCF)
Oil produced (MSTB) 46.666 40.582 40.92 0.8
Oil recovery factor (%) 39.93 34.72 35.012 0.8
Revenues of produced 5.1682 4.937 5.0436 2.2
oil and gas (MM$)
diffuse into oil. However, every performance parameter is lower than the
case without soaking except net gas produced because of less gas injected.
This means soaking cannot add benefits. Such conclusion is supported by
Meng and Sheng’s (2016a) simulation results. In some cases where the
injection pressure is close to dew point pressure, soaking time propagates
the pressure deep into the reservoir, leaving the pressure near the producing
well or fracture below the dew point pressure, resulting in more condensate
formation.
When soaking time is added, diffusion should be implemented in
the model, which is done in the case of 50-50-100 þ diffusion. By adding
diffusion, every parameter is slightly improved except gas injected.
The improvements shown in the column of “Diffusion effect, %” are
marginal. That could be a reason that the effect of soaking time is not
significant. The Sigmund (1976) method is used to calculate the molecular
binary diffusion coefficients between components in the mixture.
4.9.5 CO 2 injection performance
CO 2 EOR is very interesting, and many studies have been conducted. And
it is believed that CO 2 performs better than dry gas injection. However,
Table 4.7 shows that oil recovery factor from C 1 injection is higher than
CO 2 . This is because the injected C 1 volume is higher than the CO 2
volume, as the well injection is controlled by the same injection pressure.
In another simulation study, Sheng et al. (2016) compared huff-n-puff
performance from C 1 ,CO 2, and N 2 . The oil recovery from the CO 2
injection is little higher than that from the C 1 injection, but it is much higher
than that from the N 2 injection. The lower oil recovery in the N 2 injection