
Page 122 - Enhanced Oil Recovery in Shale and Tight Reservoirs
P. 122
Huff-n-puff injection in shale gas condensate reservoirs 109
Table 4.7 Huff-n-puff CO 2 injection performance.
C 1 CO 2
Total gas produced 3133.2 2709.6
(MMSCF)
Gas injected (MMSCF) 3008.0 2626.0
Net gas produced 125.2 83.6
(MMSCF)
Oil recovery factor (%) 39.93 37.09
is due to its high minimum miscible pressure. The effect of gas composition
in gas condensate reservoirs is complex. It depends on gas injectivity and gas
miscibility with the condensate. For shale oil reservoirs, the oil recovery by
CO 2 injection is higher than that by C 1 injection (Wan et al., 2014a).
4.10 Optimization of huff-n-puff injection
From the above discussion of factors that affect huff-n-puff injection,
we may have following designs to improve a huff-n-puff project in a
condensate reservoir:
• Maximum allowable huff pressure,
• Minimum allowable puff pressure,
• Zero soaking time.
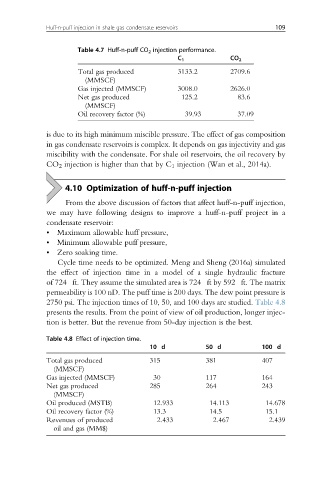
Cycle time needs to be optimized. Meng and Sheng (2016a) simulated
the effect of injection time in a model of a single hydraulic fracture
of 724 ft. They assume the simulated area is 724 ft by 592 ft. The matrix
permeability is 100 nD. The puff time is 200 days. The dew point pressure is
2750 psi. The injection times of 10, 50, and 100 days are studied. Table 4.8
presents the results. From the point of view of oil production, longer injec-
tion is better. But the revenue from 50-day injection is the best.
Table 4.8 Effect of injection time.
10 d 50 d 100 d
Total gas produced 315 381 407
(MMSCF)
Gas injected (MMSCF) 30 117 164
Net gas produced 285 264 243
(MMSCF)
Oil produced (MSTB) 12.933 14.113 14.678
Oil recovery factor (%) 13.3 14.5 15.1
Revenues of produced 2.433 2.467 2.439
oil and gas (MM$)