
Page 134 - Enhanced Oil Recovery in Shale and Tight Reservoirs
P. 134
120 Enhanced Oil Recovery in Shale and Tight Reservoirs
Table 5.2 Peng-Robinson EOS fluid description of the Bakken oil.
Initial
mole P c Acentric MW g/ Parachor
o
Comp. fraction (atm.) T c ( K) V c , L/mol) factor mole coeff.
0.0001 72.80 304.2 0.0940 0.013 44.01 78.0
CO 2
0.2203 45.24 189.7 0.0989 0.04 16.21 76.5
N 2 eC 1
0.2063 43.49 412.5 0.2039 0.0986 44.79 150.5
C 2 eC 4
0.1170 37.69 556.9 0.3324 0.1524 83.46 248.5
C 5 eC 7
C 8 eC 12 0.2815 31.04 667.5 0.4559 0.225 120.52 344.9
C 13 eC 19 0.0940 19.29 673.8 0.7649 0.1848 220.34 570.1
0.0808 15.38 792.4 1.2521 0.7527 321.52 905.7
C 20þ
Table 5.3 Binary interaction coefficients for Bakken oil.
CO 2 N 2 eC 1 C 2 eC 4 C 5 eC 7 C 8 eC 12 C 13 eC 19 C 20D
0
CO 2
0.1013 0
N 2 eC 1
0.1317 0.013 0
C 2 eC 4
0.1421 0.0358 0.0059 0
C 5 eC 7
C 8 eC 12 0.1501 0.0561 0.016 0.0025 0
0.1502 0.0976 0.0424 0.0172 0.0067 0
C 13 eC 19
0.1503 0.1449 0.0779 0.0427 0.0251 0.0061 0
C 20þ
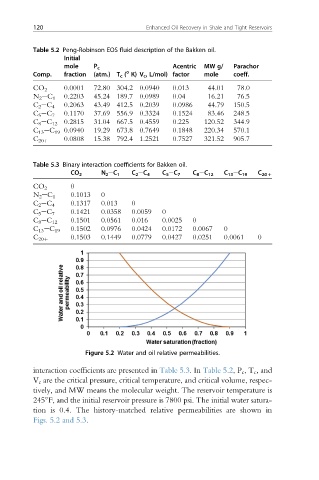
Figure 5.2 Water and oil relative permeabilities.
interaction coefficients are presented in Table 5.3.In Table 5.2,P c ,T c , and
V c are the critical pressure, critical temperature, and critical volume, respec-
tively, and MW means the molecular weight. The reservoir temperature is
245 F, and the initial reservoir pressure is 7800 psi. The initial water satura-
tion is 0.4. The history-matched relative permeabilities are shown in
Figs. 5.2 and 5.3.