
Page 135 - Enhanced Oil Recovery in Shale and Tight Reservoirs
P. 135
Optimization of huff-n-puff gas injection in shale and tight oil reservoirs 121
Figure 5.3 Gas and oil relative permeabilities.
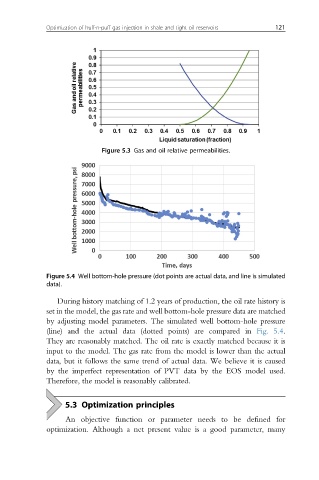
Figure 5.4 Well bottom-hole pressure (dot points are actual data, and line is simulated
data).
During history matching of 1.2 years of production, the oil rate history is
set in the model, the gas rate and well bottom-hole pressure data are matched
by adjusting model parameters. The simulated well bottom-hole pressure
(line) and the actual data (dotted points) are compared in Fig. 5.4.
They are reasonably matched. The oil rate is exactly matched because it is
input to the model. The gas rate from the model is lower than the actual
data, but it follows the same trend of actual data. We believe it is caused
by the imperfect representation of PVT data by the EOS model used.
Therefore, the model is reasonably calibrated.
5.3 Optimization principles
An objective function or parameter needs to be defined for
optimization. Although a net present value is a good parameter, many