
Page 233 - Enhanced Oil Recovery in Shale and Tight Reservoirs
P. 233
216 Enhanced Oil Recovery in Shale and Tight Reservoirs
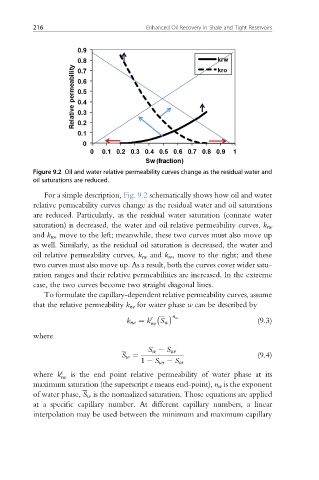
Figure 9.2 Oil and water relative permeability curves change as the residual water and
oil saturations are reduced.
For a simple description, Fig. 9.2 schematically shows how oil and water
relative permeability curves change as the residual water and oil saturations
are reduced. Particularly, as the residual water saturation (connate water
saturation) is decreased, the water and oil relative permeability curves, k rw
and k ro , move to the left; meanwhile, these two curves must also move up
as well. Similarly, as the residual oil saturation is decreased, the water and
oil relative permeability curves, k rw and k ro , move to the right; and these
two curves must also move up. As a result, both the curves cover wider satu-
ration ranges and their relative permeabilities are increased. In the extreme
case, the two curves become two straight diagonal lines.
To formulate the capillary-dependent relative permeability curves, assume
that the relative permeability k rw for water phase w can be described by
e n w
k rw ¼ k S w (9.3)
rw
where
S w S wr
S w ¼ (9.4)
1 S wr S or
where k e rw is the end point relative permeability of water phase at its
maximum saturation (the superscript e means end-point), n w is the exponent
of water phase, S w is the normalized saturation. Those equations are applied
at a specific capillary number. At different capillary numbers, a linear
interpolation may be used between the minimum and maximum capillary