
Page 235 - Enhanced Oil Recovery in Shale and Tight Reservoirs
P. 235
218 Enhanced Oil Recovery in Shale and Tight Reservoirs
Figure 9.3 Example capillary pressure curves for different wettabilities.
rock or oil cannot come out of the pores. When the rock is intermediate wet,
some oil may come out of the pores. Example capillary curves for different
wettabilities are shown in Fig. 9.3.
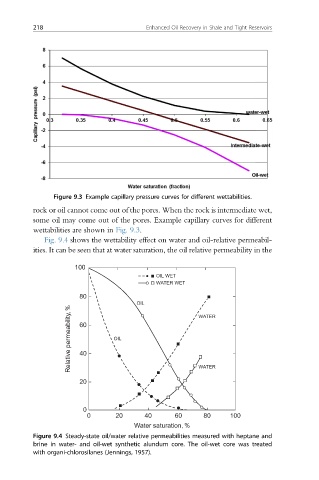
Fig. 9.4 shows the wettability effect on water and oil-relative permeabil-
ities. It can be seen that at water saturation, the oil relative permeability in the
100
OIL WET
WATER WET
80
OIL WATER
Relative permeability, % 60 OIL
40
20 WATER
0
0 20 40 60 80 100
Water saturation, %
Figure 9.4 Steady-state oil/water relative permeabilities measured with heptane and
brine in water- and oil-wet synthetic alundum core. The oil-wet core was treated
with organi-chlorosilanes (Jennings, 1957).