
Page 34 - Enhanced Oil Recovery in Shale and Tight Reservoirs
P. 34
24 Enhanced Oil Recovery in Shale and Tight Reservoirs
When the pressure is depleted faster, more cycles can be performed
within the same time, which helps further to produce more oil. When
the pressure is depleted faster, more gas sites are nucleated. Small gas bubbles
form at these gas sites. These gas bubbles grow or expand to provide energy
to drive oil out of matrix. As more gas bubbles form, it will be more difficult
for those gas bubbles to coalesce. In other words, if the pressure depletion
rate is low, large gas bubbles form and they can more easily coalesce, forming
a continuous flow path to flow out of matrix bypassing oil (Sheng et al.,
1997; 1998).
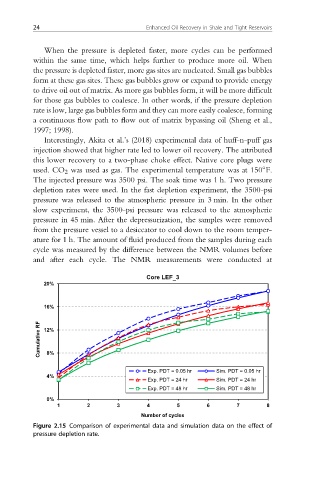
Interestingly, Akita et al.’s (2018) experimental data of huff-n-puff gas
injection showed that higher rate led to lower oil recovery. The attributed
this lower recovery to a two-phase choke effect. Native core plugs were
used. CO 2 was used as gas. The experimental temperature was at 150 F.
The injected pressure was 3500 psi. The soak time was 1 h. Two pressure
depletion rates were used. In the fast depletion experiment, the 3500-psi
pressure was released to the atmospheric pressure in 3 min. In the other
slow experiment, the 3500-psi pressure was released to the atmospheric
pressure in 45 min. After the depressurization, the samples were removed
from the pressure vessel to a desiccator to cool down to the room temper-
ature for 1 h. The amount of fluid produced from the samples during each
cycle was measured by the difference between the NMR volumes before
and after each cycle. The NMR measurements were conducted at
Core LEF_3
20%
16%
Cumulative RF 12%
8%
Exp. PDT = 0.05 hr Sim. PDT = 0.05 hr
4%
Exp. PDT = 24 hr Sim. PDT = 24 hr
Exp. PDT = 48 hr Sim. PDT = 48 hr
0%
1 2 3 4 5 6 7 8
Number of cycles
Figure 2.15 Comparison of experimental data and simulation data on the effect of
pressure depletion rate.