
Page 38 - Enhanced Oil Recovery in Shale and Tight Reservoirs
P. 38
28 Enhanced Oil Recovery in Shale and Tight Reservoirs
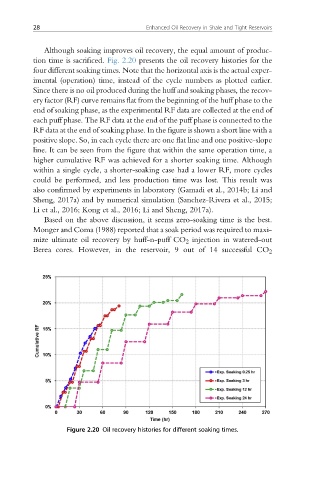
Although soaking improves oil recovery, the equal amount of produc-
tion time is sacrificed. Fig. 2.20 presents the oil recovery histories for the
four different soaking times. Note that the horizontal axis is the actual exper-
imental (operation) time, instead of the cycle numbers as plotted earlier.
Since there is no oil produced during the huff and soaking phases, the recov-
ery factor (RF) curve remains flat from the beginning of the huff phase to the
end of soaking phase, as the experimental RF data are collected at the end of
each puff phase. The RF data at the end of the puff phase is connected to the
RF data at the end of soaking phase. In the figure is shown a short line with a
positive slope. So, in each cycle there are one flat line and one positive-slope
line. It can be seen from the figure that within the same operation time, a
higher cumulative RF was achieved for a shorter soaking time. Although
within a single cycle, a shorter-soaking case had a lower RF, more cycles
could be performed, and less production time was lost. This result was
also confirmed by experiments in laboratory (Gamadi et al., 2014b; Li and
Sheng, 2017a) and by numerical simulation (Sanchez-Rivera et al., 2015;
Li et al., 2016; Kong et al., 2016; Li and Sheng, 2017a).
Based on the above discussion, it seems zero-soaking time is the best.
Monger and Coma (1988) reported that a soak period was required to maxi-
mize ultimate oil recovery by huff-n-puff CO 2 injection in watered-out
Berea cores. However, in the reservoir, 9 out of 14 successful CO 2
Figure 2.20 Oil recovery histories for different soaking times.