
Page 398 - Enhanced Oil Recovery in Shale and Tight Reservoirs
P. 398
Fracturing fluid flow back 369
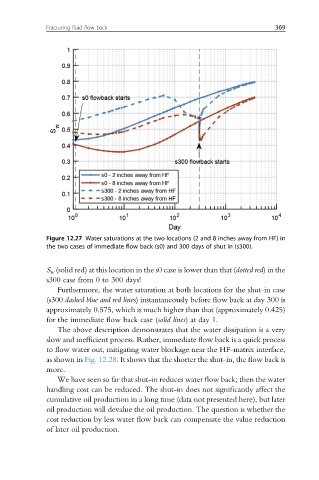
Figure 12.27 Water saturations at the two locations (2 and 8 inches away from HF) in
the two cases of immediate flow back (s0) and 300 days of shut in (s300).
S w (solid red) at this location in the s0 case is lower than that (dotted red) in the
s300 case from 0 to 300 days!
Furthermore, the water saturation at both locations for the shut-in case
(s300 dashed blue and red lines) instantaneously before flow back at day 300 is
approximately 0.575, which is much higher than that (approximately 0.425)
for the immediate flow back case (solid lines) at day 1.
The above description demonstrates that the water dissipation is a very
slow and inefficient process. Rather, immediate flow back is a quick process
to flow water out, mitigating water blockage near the HF-matrix interface,
as shown in Fig. 12.28. It shows that the shorter the shut-in, the flow back is
more.
We have seen so far that shut-in reduces water flow back; then the water
handling cost can be reduced. The shut-in does not significantly affect the
cumulative oil production in a long time (data not presented here), but later
oil production will devalue the oil production. The question is whether the
cost reduction by less water flow back can compensate the value reduction
of later oil production.