
Page 393 - Enhanced Oil Recovery in Shale and Tight Reservoirs
P. 393
364 Enhanced Oil Recovery in Shale and Tight Reservoirs
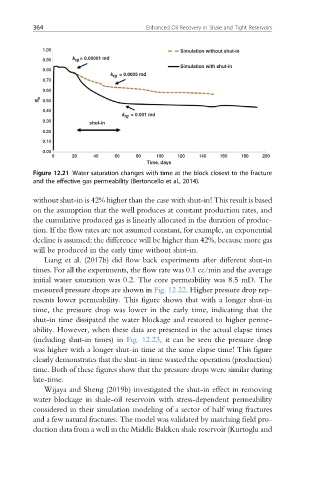
Figure 12.21 Water saturation changes with time at the block closest to the fracture
and the effective gas permeability (Bertoncello et al., 2014).
without shut-in is 42% higher than the case with shut-in! This result is based
on the assumption that the well produces at constant production rates, and
the cumulative produced gas is linearly allocated in the duration of produc-
tion. If the flow rates are not assumed constant, for example, an exponential
decline is assumed; the difference will be higher than 42%, because more gas
will be produced in the early time without shut-in.
Liang et al. (2017b) did flow back experiments after different shut-in
times. For all the experiments, the flow rate was 0.1 cc/min and the average
initial water saturation was 0.2. The core permeability was 8.5 mD. The
measured pressure drops are shown in Fig. 12.22. Higher pressure drop rep-
resents lower permeability. This figure shows that with a longer shut-in
time, the pressure drop was lower in the early time, indicating that the
shut-in time dissipated the water blockage and restored to higher perme-
ability. However, when these data are presented in the actual elapse times
(including shut-in times) in Fig. 12.23, it can be seen the pressure drop
was higher with a longer shut-in time at the same elapse time! This figure
clearly demonstrates that the shut-in time wasted the operation (production)
time. Both of these figures show that the pressure drops were similar during
late-time.
Wijaya and Sheng (2019b) investigated the shut-in effect in removing
water blockage in shale-oil reservoirs with stress-dependent permeability
considered in their simulation modeling of a sector of half wing fractures
and a few natural fractures. The model was validated by matching field pro-
duction data from a well in the Middle Bakken shale reservoir (Kurtoglu and