
Page 392 - Enhanced Oil Recovery in Shale and Tight Reservoirs
P. 392
Fracturing fluid flow back 363
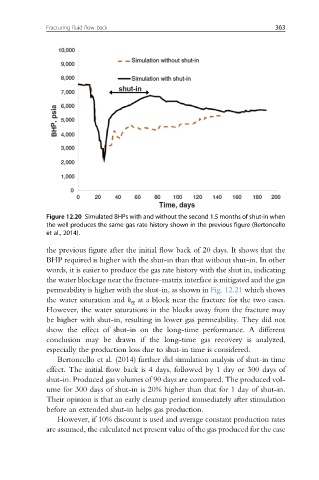
Figure 12.20 Simulated BHPs with and without the second 1.5 months of shut-in when
the well produces the same gas rate history shown in the previous figure (Bertoncello
et al., 2014).
the previous figure after the initial flow back of 20 days. It shows that the
BHP required is higher with the shut-in than that without shut-in. In other
words, it is easier to produce the gas rate history with the shut in, indicating
the water blockage near the fracture-matrix interface is mitigated and the gas
permeability is higher with the shut-in, as shown in Fig. 12.21 which shows
the water saturation and k rg at a block near the fracture for the two cases.
However, the water saturations in the blocks away from the fracture may
be higher with shut-in, resulting in lower gas permeability. They did not
show the effect of shut-in on the long-time performance. A different
conclusion may be drawn if the long-time gas recovery is analyzed,
especially the production loss due to shut-in time is considered.
Bertoncello et al. (2014) further did simulation analysis of shut-in time
effect. The initial flow back is 4 days, followed by 1 day or 300 days of
shut-in. Produced gas volumes of 90 days are compared. The produced vol-
ume for 300 days of shut-in is 20% higher than that for 1 day of shut-in.
Their opinion is that an early cleanup period immediately after stimulation
before an extended shut-in helps gas production.
However, if 10% discount is used and average constant production rates
are assumed, the calculated net present value of the gas produced for the case