
Page 419 - Enhanced Oil Recovery in Shale and Tight Reservoirs
P. 419
Fracturing fluid flow back 389
In the above equations, the subscripts water and surf represent water and
surfactant solution, respectively. The subscript max represents the maximum
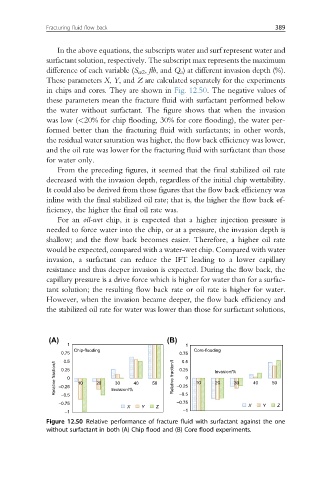
difference of each variable (S w2 , flb, and Q o ) at different invasion depth (%).
These parameters X, Y, and Z are calculated separately for the experiments
in chips and cores. They are shown in Fig. 12.50. The negative values of
these parameters mean the fracture fluid with surfactant performed below
the water without surfactant. The figure shows that when the invasion
was low (<20% for chip flooding, 30% for core flooding), the water per-
formed better than the fracturing fluid with surfactants; in other words,
the residual water saturation was higher, the flow back efficiency was lower,
and the oil rate was lower for the fracturing fluid with surfactant than those
for water only.
From the preceding figures, it seemed that the final stabilized oil rate
decreased with the invasion depth, regardless of the initial chip wettability.
It could also be derived from those figures that the flow back efficiency was
inline with the final stabilized oil rate; that is, the higher the flow back ef-
ficiency, the higher the final oil rate was.
For an oil-wet chip, it is expected that a higher injection pressure is
needed to force water into the chip, or at a pressure, the invasion depth is
shallow; and the flow back becomes easier. Therefore, a higher oil rate
would be expected, compared with a water-wet chip. Compared with water
invasion, a surfactant can reduce the IFT leading to a lower capillary
resistance and thus deeper invasion is expected. During the flow back, the
capillary pressure is a drive force which is higher for water than for a surfac-
tant solution; the resulting flow back rate or oil rate is higher for water.
However, when the invasion became deeper, the flow back efficiency and
the stabilized oil rate for water was lower than those for surfactant solutions,
(A) (B)
1 1
Chip-flooding Core-flooding
0.75 0.75
0.5 0.25
0.5
Relative fraction/l –0.25 0 10 20 Invasion/% 40 50 Relative fraction/l –0.25 0 10 Invasion/% 30 40 50
0.25
20
30
–0.5
–0.5
–0.75 –0.75 X Y Z
X Y Z
–1 –1
Figure 12.50 Relative performance of fracture fluid with surfactant against the one
without surfactant in both (A) Chip flood and (B) Core flood experiments.