
Page 415 - Enhanced Oil Recovery in Shale and Tight Reservoirs
P. 415
Fracturing fluid flow back 385
100
Ra o-R %
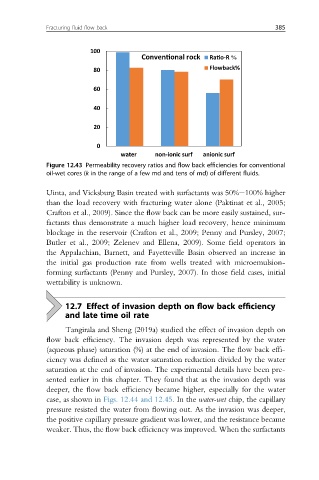
Conven onal rock
Flowback%
80
60
40
20
0
water non-ionic surf anionic surf
Figure 12.43 Permeability recovery ratios and flow back efficiencies for conventional
oil-wet cores (k in the range of a few md and tens of md) of different fluids.
Uinta, and Vicksburg Basin treated with surfactants was 50%e100% higher
than the load recovery with fracturing water alone (Paktinat et al., 2005;
Crafton et al., 2009). Since the flow back can be more easily sustained, sur-
factants thus demonstrate a much higher load recovery, hence minimum
blockage in the reservoir (Crafton et al., 2009; Penny and Pursley, 2007;
Butler et al., 2009; Zelenev and Ellena, 2009). Some field operators in
the Appalachian, Barnett, and Fayetteville Basin observed an increase in
the initial gas production rate from wells treated with microemulsion-
forming surfactants (Penny and Pursley, 2007). In those field cases, initial
wettability is unknown.
12.7 Effect of invasion depth on flow back efficiency
and late time oil rate
Tangirala and Sheng (2019a) studied the effect of invasion depth on
flow back efficiency. The invasion depth was represented by the water
(aqueous phase) saturation (%) at the end of invasion. The flow back effi-
ciency was defined as the water saturation reduction divided by the water
saturation at the end of invasion. The experimental details have been pre-
sented earlier in this chapter. They found that as the invasion depth was
deeper, the flow back efficiency became higher, especially for the water
case, as shown in Figs. 12.44 and 12.45. In the water-wet chip, the capillary
pressure resisted the water from flowing out. As the invasion was deeper,
the positive capillary pressure gradient was lower, and the resistance became
weaker. Thus, the flow back efficiency was improved. When the surfactants