
Page 410 - Enhanced Oil Recovery in Shale and Tight Reservoirs
P. 410
Fracturing fluid flow back 381
C1, C2 and C3) of w18% porosity were used in experiments. Their main
mineral component was quartz. Three fluids were used: deionized water,
nonionic surfactant, and anionic surfactant. The IFT values and contact an-
gles of these fluids are shown in Table 12.2.
Fig. 12.40 shows the oil recovery by spontaneous imbibition during the
soaking process in (a) tight cores and (b) conventional cores. From both
types of the cores, the surfactant solution which had the moderate IFT
and the function to change oil-wetness to water-wetness had the highest
oil recovery, and water had the lowest; the nonionic surfactant even
changed the cores more oil-wet but the IFT was reduced, and the oil recov-
ery stood in the middle. Those results are inline with earlier published
results.
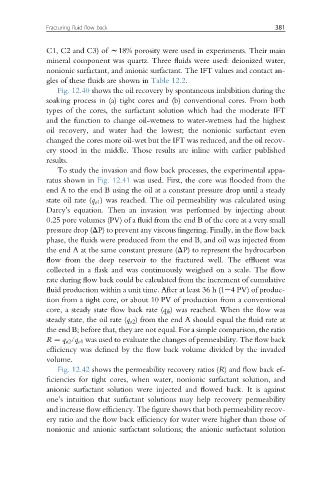
To study the invasion and flow back processes, the experimental appa-
ratus shown in Fig. 12.41 was used. First, the core was flooded from the
end A to the end B using the oil at a constant pressure drop until a steady
state oil rate (q o1 ) was reached. The oil permeability was calculated using
Darcy’s equation. Then an invasion was performed by injecting about
0.25 pore volumes (PV) of a fluid from the end B of the core at a very small
pressure drop (DP) to prevent any viscous fingering. Finally, in the flow back
phase, the fluids were produced from the end B, and oil was injected from
the end A at the same constant pressure (DP) to represent the hydrocarbon
flow from the deep reservoir to the fractured well. The effluent was
collected in a flask and was continuously weighed on a scale. The flow
rate during flow back could be calculated from the increment of cumulative
fluid production within a unit time. After at least 36 h (1e4 PV) of produc-
tion from a tight core, or about 10 PV of production from a conventional
core, a steady state flow back rate (q fb ) was reached. When the flow was
steady state, the oil rate (q o2 ) from the end A should equal the fluid rate at
the end B; before that, they are not equal. For a simple comparison, the ratio
R ¼ q o2 /q o1 was used to evaluate the changes of permeability. The flow back
efficiency was defined by the flow back volume divided by the invaded
volume.
Fig. 12.42 shows the permeability recovery ratios (R) and flow back ef-
ficiencies for tight cores, when water, nonionic surfactant solution, and
anionic surfactant solution were injected and flowed back. It is against
one’s intuition that surfactant solutions may help recovery permeability
and increase flow efficiency. The figure shows that both permeability recov-
ery ratio and the flow back efficiency for water were higher than those of
nonionic and anionic surfactant solutions; the anionic surfactant solution