
Page 408 - Enhanced Oil Recovery in Shale and Tight Reservoirs
P. 408
Fracturing fluid flow back 379
not find that 7 days of shut-in was detrimental to fracture conductivity and
the negative skin values were not indicative of increased polymer damage.
12.6 Effect of initial wettability on flow back
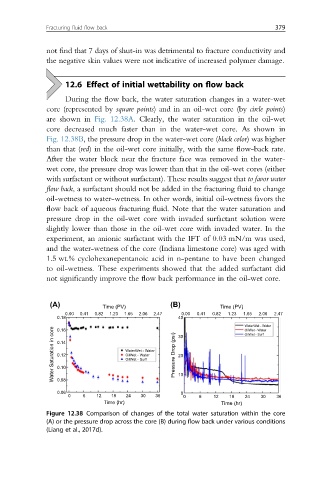
During the flow back, the water saturation changes in a water-wet
core (represented by square points) and in an oil-wet core (by circle points)
are shown in Fig. 12.38A. Clearly, the water saturation in the oil-wet
core decreased much faster than in the water-wet core. As shown in
Fig. 12.38B, the pressure drop in the water-wet core (black color) was higher
than that (red) in the oil-wet core initially, with the same flow-back rate.
After the water block near the fracture face was removed in the water-
wet core, the pressure drop was lower than that in the oil-wet cores (either
with surfactant or without surfactant). These results suggest that to favor water
flow back, a surfactant should not be added in the fracturing fluid to change
oil-wetness to water-wetness. In other words, initial oil-wetness favors the
flow back of aqueous fracturing fluid. Note that the water saturation and
pressure drop in the oil-wet core with invaded surfactant solution were
slightly lower than those in the oil-wet core with invaded water. In the
experiment, an anionic surfactant with the IFT of 0.03 mN/m was used,
and the water-wetness of the core (Indiana limestone core) was aged with
1.5 wt.% cyclohexanepentanoic acid in n-pentane to have been changed
to oil-wetness. These experiments showed that the added surfactant did
not significantly improve the flow back performance in the oil-wet core.
(A) Time (PV) (B) Time (PV)
0.00 0.41 0.82 1.23 1.65 2.06 2.47 0.00 0.41 0.82 1.23 1.65 2.06 2.47
0.18 40
WaterWet - Water
Water Saturation in core 0.14 WaterWet - Water Pressure Drop (psi) 20
0.16
OilWet - Water
OilWet - Surf
30
OilWet - Water
0.12
OilWet - Surf
0.10
0.08
0.06 10 0
0 6 12 18 24 30 36 0 6 12 18 24 30 36
Time (hr) Time (hr)
Figure 12.38 Comparison of changes of the total water saturation within the core
(A) or the pressure drop across the core (B) during flow back under various conditions
(Liang et al., 2017d).