
Page 406 - Enhanced Oil Recovery in Shale and Tight Reservoirs
P. 406
Fracturing fluid flow back 377
time in days. The figure shows that the apparent length for ITM fluid wells
did not change with the delay time, while the apparent length for non-ITM
fluid wells decreased as the delay time was longer. Their conclusion or inter-
pretation was that the damage from the delay was quick (damaged observed
for short delay times), persistent, and significant. At least, the short delay was
not beneficial.
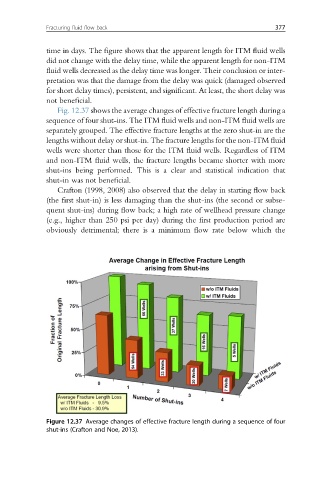
Fig. 12.37 shows the average changes of effective fracture length during a
sequence of four shut-ins. The ITM fluid wells and non-ITM fluid wells are
separately grouped. The effective fracture lengths at the zero shut-in are the
lengths without delay or shut-in. The fracture lengths for the non-ITM fluid
wells were shorter than those for the ITM fluid wells. Regardless of ITM
and non-ITM fluid wells, the fracture lengths became shorter with more
shut-ins being performed. This is a clear and statistical indication that
shut-in was not beneficial.
Crafton (1998, 2008) also observed that the delay in starting flow back
(the first shut-in) is less damaging than the shut-ins (the second or subse-
quent shut-ins) during flow back; a high rate of wellhead pressure change
(e.g., higher than 250 psi per day) during the first production period are
obviously detrimental; there is a minimum flow rate below which the
Figure 12.37 Average changes of effective fracture length during a sequence of four
shut-ins (Crafton and Noe, 2013).