
Page 45 - Enhanced Oil Recovery in Shale and Tight Reservoirs
P. 45
Huff-n-puff gas injection in oil reservoirs 33
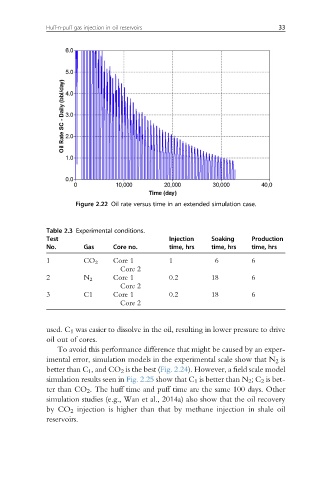
Figure 2.22 Oil rate versus time in an extended simulation case.
Table 2.3 Experimental conditions.
Test Injection Soaking Production
No. Gas Core no. time, hrs time, hrs time, hrs
1 CO 2 Core 1 1 6 6
Core 2
2 N 2 Core 1 0.2 18 6
Core 2
3 C1 Core 1 0.2 18 6
Core 2
used. C 1 was easier to dissolve in the oil, resulting in lower pressure to drive
oil out of cores.
To avoid this performance difference that might be caused by an exper-
imental error, simulation models in the experimental scale show that N 2 is
better than C 1 , and CO 2 is the best (Fig. 2.24). However, a field scale model
simulation results seen in Fig. 2.25 show that C 1 is better than N 2 ;C 2 is bet-
ter than CO 2 . The huff time and puff time are the same 100 days. Other
simulation studies (e.g., Wan et al., 2014a) also show that the oil recovery
by CO 2 injection is higher than that by methane injection in shale oil
reservoirs.