
Page 49 - Environmental Control in Petroleum Engineering
P. 49
Drilling and Production Operations 37
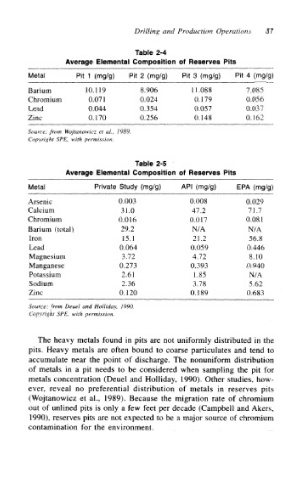
Table 2-4
Average Elemental Composition of Reserves Pits
Metal Pit 1 (mg/g) Pit 2 (mg/g) Pit 3 (mg/g) Pit 4 (mg/g)
Barium 10.119 8.906 11.088 7.085
Chromium 0.071 0.024 0.179 0.056
Lead 0.044 0.354 0.057 0.037
Zinc 0.170 0.256 0.148 0.162
Source: from Wojtanowicz et at., 1989.
Copyright SPE, with permission
Table 2-5
Average Elemental Composition of Reserves Pits
Metal Private Study (mg/g) API (mg/g) EPA (mg/g)
Arsenic 0.003 0.008 0.029
Calcium 31.0 47.2 71.7
Chromium 0.016 0.017 0.081
Barium (total) 29.2 N/A N/A
Iron 15.1 21.2 56,8
Lead 0.064 0.059 0.446
Magnesium 3.72 4.72 8.10
Manganese 0.273 0.393 0.940
Potassium 2.61 1.85 N/A
Sodium 2.36 3.78 5.62
Zinc 0.120 0.189 0.683
Source: from Deuel and Holliday, 1990.
Copyright SPE, with permission.
The heavy metals found in pits are not uniformly distributed in the
pits. Heavy metals are often bound to coarse particulates and tend to
accumulate near the point of discharge. The nonuniform distribution
of metals in a pit needs to be considered when sampling the pit for
metals concentration (Deuel and Holliday, 1990). Other studies, how-
ever, reveal no preferential distribution of metals in reserves pits
(Wojtanowicz et al., 1989). Because the migration rate of chromium
out of unlined pits is only a few feet per decade (Campbell and Akers,
1990), reserves pits are not expected to be a major source of chromium
contamination for the environment.