
Page 165 - Essentials of physical chemistry
P. 165
Gibbs’ Free Energy and Equilibria 127
x
f vs. Temperature
0.9
f
0.8 0
f
1
0.7 f
2
f
0.6 3
f 4
Fractions 0.5
0.4
0.3
0.2
0.1
0
0 10 20 30 40 50 60 70 80 90 100
Temperature (°C)
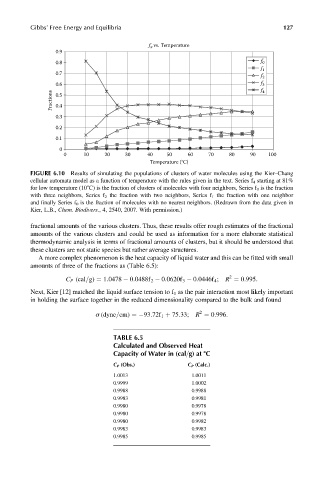
FIGURE 6.10 Results of simulating the populations of clusters of water molecules using the Kier–Chang
cellular automata model as a function of temperature with the rules given in the text. Series f 4 starting at 81%
for low temperature (108C) is the fraction of clusters of molecules with four neighbors, Series f 3 is the fraction
with three neighbors, Series f 2 the fraction with two neighbors, Series f 1 the fraction with one neighbor
and finally Series f 0 is the fraction of molecules with no nearest neighbors. (Redrawn from the data given in
Kier, L.B., Chem. Biodivers., 4, 2540, 2007. With permission.)
fractional amounts of the various clusters. Thus, these results offer rough estimates of the fractional
amounts of the various clusters and could be used as information for a more elaborate statistical
thermodynamic analysis in terms of fractional amounts of clusters, but it should be understood that
these clusters are not static species but rather average structures.
A more complex phenomenon is the heat capacity of liquid water and this can be fitted with small
amounts of three of the fractions as (Table 6.5):
2
C P (cal=g) ¼ 1:0478 0:0488f 2 0:0620f 3 0:0446f 4 ; R ¼ 0:995:
Next, Kier [12] matched the liquid surface tension to f 1 as the pair interaction most likely important
in holding the surface together in the reduced dimensionality compared to the bulk and found
2
s (dyne=cm) ¼ 93:72f 1 þ 75:33; R ¼ 0:996:
TABLE 6.5
Calculated and Observed Heat
Capacity of Water in (cal=g) at 8C
C P (Obs.) C P (Calc.)
1.0013 1.0011
0.9999 1.0002
0.9988 0.9988
0.9983 0.9981
0.9980 0.9978
0.9980 0.9978
0.9980 0.9982
0.9983 0.9983
0.9985 0.9985