
Page 253 - Essentials of physical chemistry
P. 253
Early Experiments in Quantum Physics 215
0.25
0.20
Fraction of radiant power 0.15 1000°K
0.10
500°K
300°K
0.05
200°K
100°K
0
0 5 10 15 20 25 30 35 40
(a) Wavelength, μm
Blackbody lambda (max) vs. T (°K)
120
y =0.0103x+0.0014
2
100
R =1
80
60
40
20
0
0 2,000 4,000 6,000 8,000 10,000 12,000
(b) T (°K)
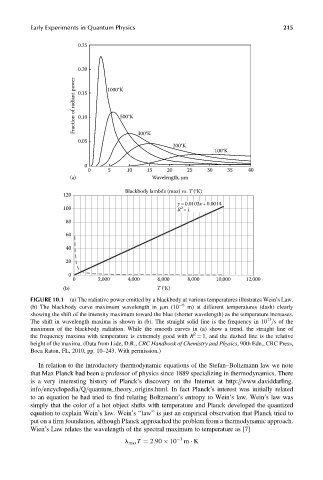
FIGURE 10.1 (a) The radiative power emitted by a blackbody at various temperatures illustrates Wein’s Law.
(b) The blackbody curve maximum wavelength in mm (10 6 m) at different temperatures (dash) clearly
showing the shift of the intensity maximum toward the blue (shorter wavelength) as the temperature increases.
13
The shift in wavelength maxima is shown in (b). The straight solid line is the frequency in 10 =s of the
maximum of the blackbody radiation. While the smooth curves in (a) show a trend, the straight line of
2
the frequency maxima with temperature is extremely good with R ¼ 1, and the dashed line is the relative
height of the maxima. (Data from Lide, D.R., CRC Handbook of Chemistry and Physics, 90th Edn., CRC Press,
Boca Raton, FL, 2010, pp. 10–243. With permission.)
In relation to the introductory thermodynamic equations of the Stefan–Boltzmann law we note
that Max Planck had been a professor of physics since 1889 specializing in thermodynamics. There
is a very interesting history of Planck’s discovery on the Internet at http:==www.daviddarling.
info=encyclopedia=Q=quantum_theory_origins.html. In fact Planck’s interest was initially related
to an equation he had tried to find relating Boltzmann’s entropy to Wein’s law. Wein’s law was
simply that the color of a hot object shifts with temperature and Planck developed the quantized
equation to explain Wein’s law. Wein’s ‘‘law’’ is just an empirical observation that Planck tried to
put on a firm foundation, although Planck approached the problem from a thermodynamic approach.
Wien’s Law relates the wavelength of the spectral maximum to temperature as [7]
3
l max T ¼ 2:90 10 m K