
Page 71 - Essentials of physical chemistry
P. 71
Viscosity of Laminar Flow 33
1.6
Viscosity (mPa s) 1.4 1
1.2
0.8
0.6
0.4
0.2
0
0 5 10 15 20 25
3
C (kg/m )
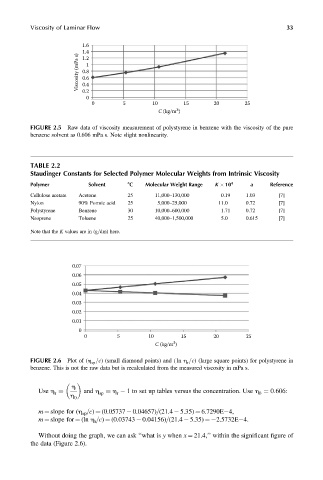
FIGURE 2.5 Raw data of viscosity measurement of polystyrene in benzene with the viscosity of the pure
benzene solvent as 0.606 mPa s. Note slight nonlinearity.
TABLE 2.2
Staudinger Constants for Selected Polymer Molecular Weights from Intrinsic Viscosity
Polymer Solvent 8C Molecular Weight Range K 10 4 a Reference
Cellulose acetate Acetone 25 11,000–130,000 0.19 1.03 [7]
Nylon 90% Formic acid 25 5,000–25,000 11.0 0.72 [7]
Polystyrene Benzene 30 10,000–600,000 1.71 0.72 [7]
Neoprene Toluene 25 40,000–1,500,000 5.0 0.615 [7]
Note that the K values are in (g=dm) here.
0.07
0.06
0.05
0.04
0.03
0.02
0.01
0
0 5 10 15 20 25
3
C (kg/m )
FIGURE 2.6 Plot of (h =c) (small diamond points) and (ln h =c) (large square points) for polystyrene in
r
sp
benzene. This is not the raw data but is recalculated from the measured viscosity in mPa s.
h
and h h 1 to set up tables versus the concentration. Use h ¼ 0:606:
r
h 0
Use h sp r 0
m ¼ slope for (h sp =c) ¼ (0.05737 0.04657)=(21.4 5.35) ¼ 6.7290E 4,
m ¼ slope for ¼ (ln h r =c) ¼ (0.03743 0.04156)=(21.4 5.35) ¼ 2.5732E 4.
Without doing the graph, we can ask ‘‘what is y when x ¼ 21.4,’’ within the significant figure of
the data (Figure 2.6).