
Page 255 - Excel 2007 Bible
P. 255
17_044039 ch12.qxp 11/21/06 11:05 AM Page 212
Part II
Working with Formulas and Functions
Displaying formatted currency values as text
The Excel DOLLAR function converts a number to text using the currency format. It takes two arguments:
the number to convert, and the number of decimal places to display. The DOLLAR function uses the
regional currency symbol (for example, a $).
You can sometimes use the DOLLAR function in place of the TEXT function. The TEXT function, however,
is much more flexible because it doesn’t limit you to a specific number format.
The following formula returns Total: $1,287.37 (the second argument for the DOLLAR function speci-
fies the number of decimal places):
=”Total: “&DOLLAR(1287.367, 2)
Repeating a character or string
The REPT function repeats a text string (first argument) any number of times you specify (second argument).
For example, this formula returns HoHoHo:
=REPT(“Ho”,3)
You can also use this function to create crude vertical dividers between cells. This example displays a squig-
gly line, 20 characters in length:
=REPT(“~”,20)
Creating a text histogram
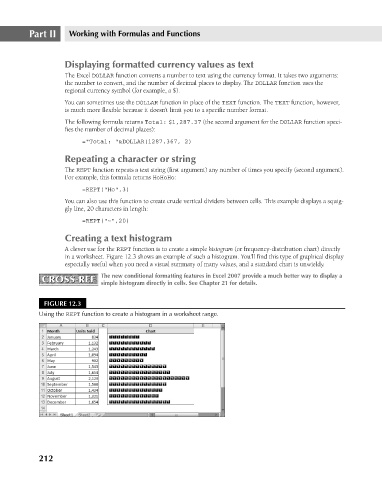
A clever use for the REPT function is to create a simple histogram (or frequency-distribution chart) directly
in a worksheet. Figure 12.3 shows an example of such a histogram. You’ll find this type of graphical display
especially useful when you need a visual summary of many values, and a standard chart is unwieldy.
CROSS-REF The new conditional formatting features in Excel 2007 provide a much better way to display a
CROSS-REF
simple histogram directly in cells. See Chapter 21 for details.
FIGURE 12.3
Using the REPT function to create a histogram in a worksheet range.
212