
Page 265 - Excel Data Analysis
P. 265
14 537547 AppB.qxd 3/4/03 11:57 AM Page 251
EXCEL FUNCTION QUICK REFERENCE B
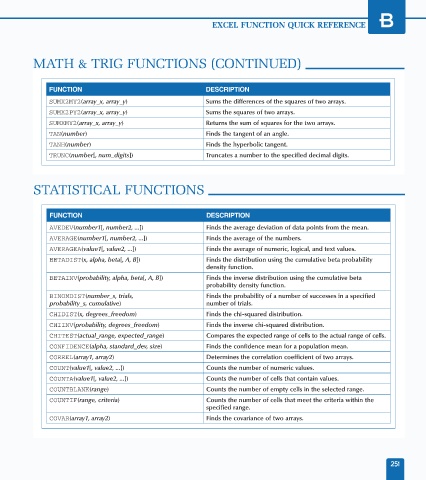
MATH & TRIG FUNCTIONS (CONTINUED)
FUNCTION DESCRIPTION
SUMX2MY2(array_x, array_y) Sums the differences of the squares of two arrays.
SUMX2PY2(array_x, array_y) Sums the squares of two arrays.
SUMXMY2(array_x, array_y) Returns the sum of squares for the two arrays.
TAN(number) Finds the tangent of an angle.
TANH(number) Finds the hyperbolic tangent.
TRUNC(number[, num_digits]) Truncates a number to the specified decimal digits.
STATISTICAL FUNCTIONS
FUNCTION DESCRIPTION
AVEDEV(number1[, number2, ...]) Finds the average deviation of data points from the mean.
AVERAGE(number1[, number2, ...]) Finds the average of the numbers.
AVERAGEA(value1[, value2, ...]) Finds the average of numeric, logical, and text values.
BETADIST(x, alpha, beta[, A, B]) Finds the distribution using the cumulative beta probability
density function.
BETAINV(probability, alpha, beta[, A, B]) Finds the inverse distribution using the cumulative beta
probability density function.
BINOMDIST(number_s, trials, Finds the probability of a number of successes in a specified
probability_s, cumulative) number of trials.
CHIDIST(x, degrees_freedom) Finds the chi-squared distribution.
CHIINV(probability, degrees_freedom) Finds the inverse chi-squared distribution.
CHITEST(actual_range, expected_range) Compares the expected range of cells to the actual range of cells.
CONFIDENCE(alpha, standard_dev, size) Finds the confidence mean for a population mean.
CORREL(array1, array2) Determines the correlation coefficient of two arrays.
COUNT(value1[, value2, ...]) Counts the number of numeric values.
COUNTA(value1[, value2, ...]) Counts the number of cells that contain values.
COUNTBLANK(range) Counts the number of empty cells in the selected range.
COUNTIF(range, criteria) Counts the number of cells that meet the criteria within the
specified range.
COVAR(array1, array2) Finds the covariance of two arrays.
251