
Page 265 - Excel Workbook for Dummies
P. 265
27_798452 ch19.qxp 3/13/06 7:42 PM Page 248
248 Part V: Doing Data Analysis
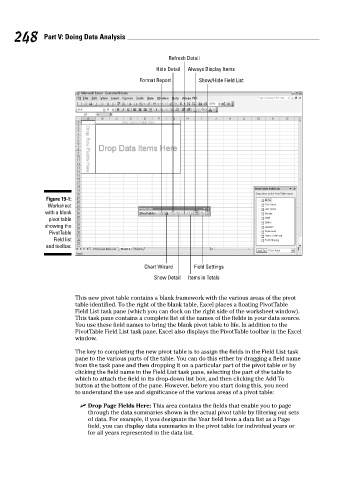
Refresh Detail
Hide Detail Always Display Items
Format Report Show/Hide Field List
Figure 19-1:
Worksheet
with a blank
pivot table
showing the
PivotTable
Field list
and toolbar.
Chart Wizard Field Settings
Show Detail Items in Totals
This new pivot table contains a blank framework with the various areas of the pivot
table identified. To the right of the blank table, Excel places a floating PivotTable
Field List task pane (which you can dock on the right side of the worksheet window).
This task pane contains a complete list of the names of the fields in your data source.
You use these field names to bring the blank pivot table to life. In addition to the
PivotTable Field List task pane, Excel also displays the PivotTable toolbar in the Excel
window.
The key to completing the new pivot table is to assign the fields in the Field List task
pane to the various parts of the table. You can do this either by dragging a field name
from the task pane and then dropping it on a particular part of the pivot table or by
clicking the field name in the Field List task pane, selecting the part of the table to
which to attach the field in its drop-down list box, and then clicking the Add To
button at the bottom of the pane. However, before you start doing this, you need
to understand the use and significance of the various areas of a pivot table:
Drop Page Fields Here: This area contains the fields that enable you to page
through the data summaries shown in the actual pivot table by filtering out sets
of data. For example, if you designate the Year field from a data list as a Page
field, you can display data summaries in the pivot table for individual years or
for all years represented in the data list.