
Page 114 - Excel for Scientists and Engineers: Numerical Methods
P. 114
CHAPTER 5 INTERPOLATION 91
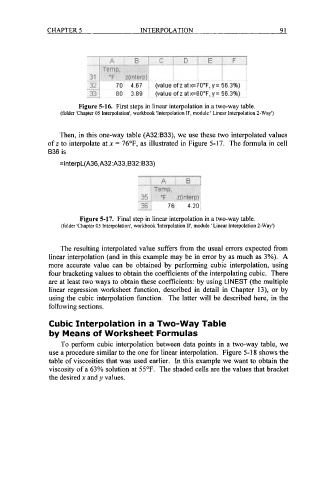
Figure 5-16. First steps in linear interpolation in a two-way table.
(folder 'Chapter 05 Interpolation', workbook 'Interpolation II', module ' Linear Interpolation 2-Way')
Then, in this one-way table (A32:833), we use these two interpolated values
of z to interpolate at x = 76"F, as illustrated in Figure 5-17. The formula in cell
836 is
=lnterpL(A36,A32:A33,B32: B33)
Figure 5-17. Final step in linear interpolation in a two-way table.
(folder 'Chapter 05 Interpolation', workbook 'Interpolation II', module ' Linear Interpolation 2-Way')
The resulting interpolated value suffers from the usual errors expected from
linear interpolation (and in this example may be in error by as much as 3%). A
more accurate value can be obtained by performing cubic interpolation, using
four bracketing values to obtain the coefficients of the interpolating cubic. There
are at least two ways to obtain these coefficients: by using LINEST (the multiple
linear regression worksheet function, described in detail in Chapter 13), or by
using the cubic interpolation function. The latter will be described here, in the
following sections.
Cubic Interpolation in a Two-way Table
by Means of Worksheet Formulas
To perform cubic interpolation between data points in a two-way table, we
use a procedure similar to the one for linear interpolation. Figure 5-1 8 shows the
table of viscosities that was used earlier. In this example we want to obtain the
viscosity of a 63% solution at 55'F. The shaded cells are the values that bracket
the desired x and y values.