
Page 109 - Excel for Scientists and Engineers: Numerical Methods
P. 109
86 EXCEL: NUMERICAL METHODS
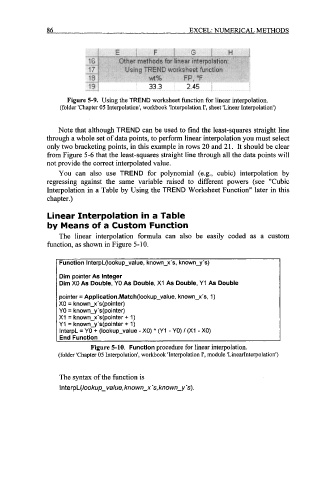
Figure 5-9. Using the TREND worksheet function for linear interpolation.
(folder 'Chapter 05 Interpolation', workbook 'Interpolation I', sheet 'Linear Interpolation')
Note that although TREND can be used to find the least-squares straight line
through a whole set of data points, to perform linear interpolation you must select
only two bracketing points, in this example in rows 20 and 21. It should be clear
from Figure 5-6 that the least-squares straight line through all the data points will
not provide the correct interpolated value.
You can also use TREND for polynomial (e.g., cubic) interpolation by
regressing against the same variable raised to different powers (see "Cubic
Interpolation in a Table by Using the TREND Worksheet Function" later in this
chapter.)
Linear Interpolation in a Table
by Means of a Custom Function
The linear interpolation formula can also be easily coded as a custom
function, as shown in Figure 5-10.
Function InterpL(1ookup-value, known-x's, known-y's)
Dim pointer As Integer
Dim XO As Double, YO As Double, XI As Double, Y1 As Double
pointer = Application.Match(lookup-value, known-x's, 1)
XO = known-x's(pointer)
YO = known-y's(pointer)
XI = known-x's(pointer + 1)
Y1 = known_y's(pointer + 1)
InterpL = YO + (lookup-value - XO) * (Yl - YO) / (XI - XO)
End Function
Figure 5-10. Function procedure for linear interpolation.
(folder 'Chapter 05 Interpolation', workbook 'Interpolation 1', module 'Linearhterpolation')
The syntax of the function is
In terpL( lookup- value, known-x 's, known-y 's).