
Page 107 - Excel for Scientists and Engineers: Numerical Methods
P. 107
84 EXCEL: NUMERICAL METHODS
In the following example, we'll assume that values of the independent
variable x in the table are in ascending order, as in Figure 5-1, where the
independent variable is wt% ethylene glycol. We want to find the freezing point
for certain wt% values. Figure 5-2 shows the data (see folder 'Chapter 05
Interpolation', workbook 'Interpolation 1', sheet 'Linear Interpolation'); it's clear
that, since most of the points are close together, we can use linear interpolation
without introducing too much error.
You can create a linear interpolation formula using Excel's MATCH and
INDEX functions. If match-type-num = 1, MATCH returns the position of the
largest array value that is less than or equal to lookup-value. The array must be
in ascending order. Use this value in the INDEX function to return the values of
XO, yo, XI and y~, shown in the following:
as
position =MATCH(lookup-value, known-x's, 1)
XO =INDEX( known-x's, position)
XI =INDEX(known-x-s,position+l)
Yo =INDEX( known-y 's,position)
YI =IN DEX(known-y's, position+l )
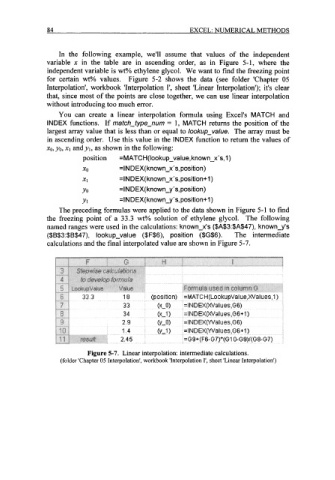
The preceding formulas were applied to the data shown in Figure 5-1 to find
the freezing point of a 33.3 wt% solution of ethylene glycol. The following
named ranges were used in the calculations: known-x's ($A$3:$A$47), known-y's
($B$3:$B$47), lookup-value ($F$6), position ($G$6). The intermediate
calculations and the final interpolated value are shown in Figure 5-7.
Figure 5-7. Linear interpolation: intermediate calculations.
(folder 'Chapter 05 Interpolation', workbook 'Interpolation 1', sheet 'Linear Interpolation')