
Page 187 - Excel for Scientists and Engineers: Numerical Methods
P. 187
164 EXCEL: NUMERICAL METHODS
If IsError(EvaIuate(temp)) Then GoTo ptl
T = temp
ptl: Next J
Y1 = Evaluate(T)
T = Formulastring 'Begin with original formula again.
If XI = 0 Then XI = delta-x
X2 =XI + XI * delta-x
For J = NRepl To 1 Step -1
temp = Application.Substitute(T, XRef, X2 & " 'I, J)
If IsError(Evaluate(temp)) Then GoTo pt2
T = temp
pt2: Next J
Y2 = Evaluate(T)
m = (Y2 - Y1) I (XI * delta-x)
X3=X1 -Y1 Im
'Exit here if a root is found
If Abs(X3 - XI) c tolerance Then NewtRaph = X3: Exit Function
XI =x3
Next I
'Exit here with error value if no root found
NewtRaph = CVErr(x1ErrNA)
End Function
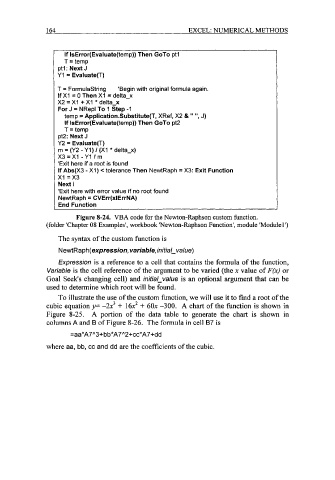
Figure 8-24. VBA code for the Newton-Raphson custom function.
(folder 'Chapter 08 Examples', workbook Wewton-Raphson Function', module 'Module 1 ')
The syntax of the custom function is
Newt Ra p h (expression, variable, initial_ value)
Expression is a reference to a cell that contains the formula of the function,
Variable is the cell reference of the argument to be varied (the x value of F(x) or
Goal Seek's changing cell) and initiaLvalue is an optional argument that can be
used to determine which root will be found.
To illustrate the use of the custom function, we will use it to find a root of the
cubic equation y= -2x3 + 16x2 + 60x -300. A chart of the function is shown in
Figure 8-25. A portion of the data table to generate the chart is shown in
columns A and B of Figure 8-26. The formula in cell B7 is
=aa*A7A3+ bb*A7"2+cc*A7+dd
where aa, bb, cc and dd are the coefficients of the cubic.