
Page 204 - Excel for Scientists and Engineers: Numerical Methods
P. 204
CHAPTER 8 ROOTS OF EQUATIONS 181
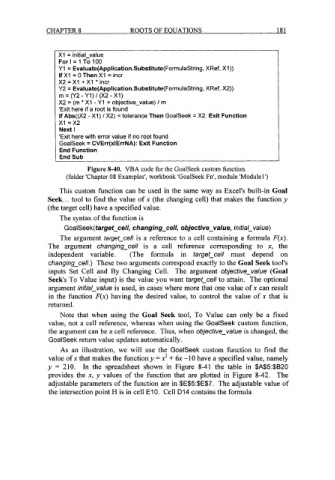
XI = initial-value
For I = 1 To 100
Y1 = Evaluate(Application.Substitute(FormulaString, XRef, XI))
If XI = 0 Then XI = incr
X2 =XI + XI * incr
Y2 = Evaluate(Application.Substitute(FormulaString, XRef, X2))
m = (Y2 - Y1) I (X2 -XI)
X2 = (m * XI - Y1 + objective-value) I m
'Exit here if a root is found
If Abs((X2 - XI) I X2) c tolerance Then GoalSeek = X2: Exit Function
XI =x2
Next I
'Exit here with error value if no root found
GoalSeek = CVErr(x1ErrNA): Exit Function
End Function
End Sub
Figure 8-40. VBA code for the GoalSeek custom function.
(folder 'Chapter 08 Examples', workbook 'GoalSeek Fn', module 'Module 1')
This custom function can be used in the same way as Excel's built-in Goal
Seek.. . tool to find the value of x (the changing cell) that makes the function y
(the target cell) have a specified value.
The syntax of the function is
GoaISeek(target-cel/, changing-cell, objective-value, initial_value)
The argument targetcell is a reference to a cell containing a formula F(x).
The argument changing-cell is a cell reference corresponding to x, the
independent variable. (The formula in fargef-cell must depend on
changing-cell.) These two arguments correspond exactly to the Goal Seek tool's
inputs Set Cell and By Changing Cell. The argument objective-value (Goal
Seek's To Value input) is the value you want fargef-cell to attain. The optional
argument inifial_value is used, in cases where more that one value of x can result
in the function F(x) having the desired value, to control the value of x that is
returned.
Note that when using the Goal Seek tool, To Value can only be a fixed
value, not a cell reference, whereas when using the GoalSeek custom function,
the argument can be a cell reference. Thus, when objecfive-value is changed, the
GoalSeek return value updates automatically.
As an illustration, we will use the GoalSeek custom function to find the
value of x that makes the function y = x2 + 6x -10 have a specified value, namely
y = 210. In the spreadsheet shown in Figure 8-41 the table in $A$5:$B20
provides the x, y values of the function that are plotted in Figure 8-42. The
adjustable parameters of the function are in $E$5:$E$7. The adjustable value of
the intersection point H is in cell E10. Cell D14 contains the formula