
Page 200 - Excel for Scientists and Engineers: Numerical Methods
P. 200
CHAPTER 8 ROOTS OF EQUATIONS 177
300
250
200
150
100
50
0
5 10 15 20
-50
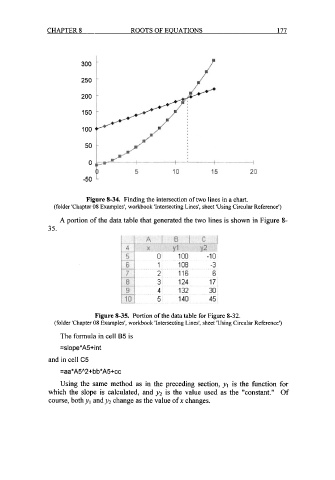
Figure 8-34. Finding the intersection of two lines in a chart.
(folder 'Chapter 08 Examples', workbook 'Intersecting Lines', sheet 'Using Circular Reference')
A portion of the data table that generated the two lines is shown in Figure 8-
35.
Figure 8-35. Portion of the data table for Figure 8-32.
(folder 'Chapter 08 Examples', workbook 'Intersecting Lines', sheet 'Using Circular Reference')
The formula in cell B5 is
=slope*AS+int
and in cell C5
=aa*A5"2+ bb*A5+cc
Using the same method as in the preceding section, y1 is the function for
which the slope is calculated, and y2 is the value used as the "constant." Of
course, both yl and y2 change as the value of x changes.