
Page 198 - Excel for Scientists and Engineers: Numerical Methods
P. 198
CHAPTER 8 ROOTS OF EQUATIONS 175
120
100
80
60
40
20
0 I
20
-20
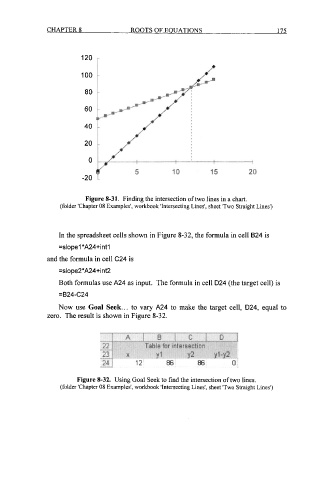
Figure 8-31. Finding the intersection of two lines in a chart.
(folder 'Chapter 08 Examples', workbook 'Intersecting Lines', sheet 'Two Straight Lines')
In the spreadsheet cells shown in Figure 8-32, the formula in cell 824 is
=slope 1 *A24+ i n t 1
and the formula in cell C24 is
=slope2*A24+int2
Both formulas use A24 as input. The formula in cell D24 (the target cell) is
=B24-C24
Now use Goal Seek ... to vary A24 to make the target cell, D24, equal to
zero. The result is shown in Figure 8-32.
Figure 8-32. Using Goal Seek to find the intersection of two lines.
(folder 'Chapter 08 Examples', workbook 'Intersecting Lines', sheet 'Two Straight Lines')