
Page 222 - Excel for Scientists and Engineers: Numerical Methods
P. 222
CHAPTER 9 SYSTEMS OF SIMULTANEOUS EOUATIONS 199
Figure 9-6. Data table for use with the GaussElim or GaussJordan functions.
(folder 'Chapter 09 Simultaneous Equations', workbook 'Simult Eqns II', sheet 'Elimination Fns')
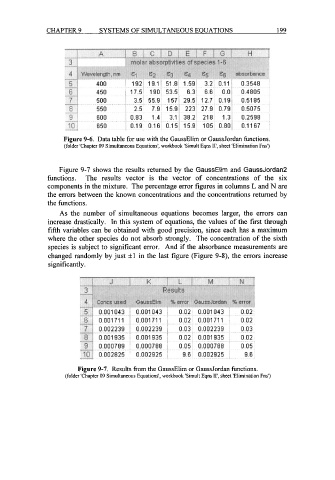
Figure 9-7 shows the results returned by the GaussElirn and GaussJordan2
functions. The results vector is the vector of concentrations of the six
components in the mixture. The percentage error figures in columns L and N are
the errors between the known concentrations and the concentrations returned by
the functions.
As the number of simultaneous equations becomes larger, the errors can
increase drastically. In this system of equations, the values of the first through
fifth variables can be obtained with good precision, since each has a maximum
where the other species do not absorb strongly. The concentration of the sixth
species is subject to significant error. And if the absorbance measurements are
changed randomly by just -tl in the last figure (Figure 9-S), the errors increase
significantly.
Figure 9-7. Results from the GaussElim or GaussJordan functions.
(folder 'Chapter 09 Simultaneous Equations', workbook 'Simult Eqns II', sheet 'Elimination Fns')