
Page 237 - Excel for Scientists and Engineers: Numerical Methods
P. 237
214 EXCEL: NUMERICAL METHODS
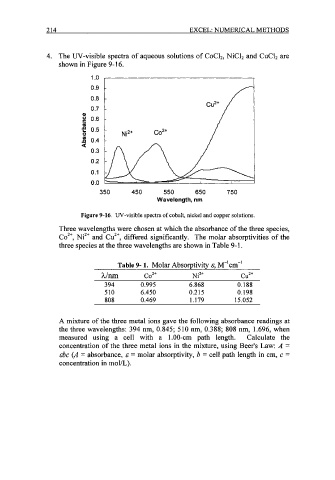
4. The W-visible spectra of aqueous solutions of CoC12, NiCI2 and CuC12 are
shown in Figure 9- 16.
0
2 0.6
m /
g 0.5 [ Ni2+ CO2'
d 0.4
U
0.3
0.2
0.1
0.0
350 450 550 650 750
Wavelength, nrn
Figure 9-16. W-visible spectra of cobalt, nickel and copper solutions.
Three wavelengths were chosen at which the absorbance of the three species,
Co2+, Ni2+ and Cu2+, differed significantly. The molar absorptivities of the
three species at the three wavelengths are shown in Table 9-1.
Table 9- 1. Molar Absorptivity E, M-'cm-'
h/nm co2+ Ni2+ cuz+
394 0.995 6.868 0.188
510 6.450 0.2 15 0.198
808 0.469 1.179 15.052
A mixture of the three metal ions gave the following absorbance readings at
the three wavelengths: 394 nm, 0.845; 510 nm, 0.388; 808 nm, 1.696, when
measured using a cell with a 1.00-cm path length. Calculate the
concentration of the three metal ions in the mixture, using Beer's Law: A =
~bc (A = absorbance, E= molar absorptivity, b = cell path length in cm, c =
concentration in mol/L).