
Page 173 - Fair, Geyer, and Okun's Water and wastewater engineering : water supply and wastewater removal
P. 173
JWCL344_ch04_118-153.qxd 8/2/10 9:18 PM Page 135
4.4 Variations or Patterns of Water Demand 135
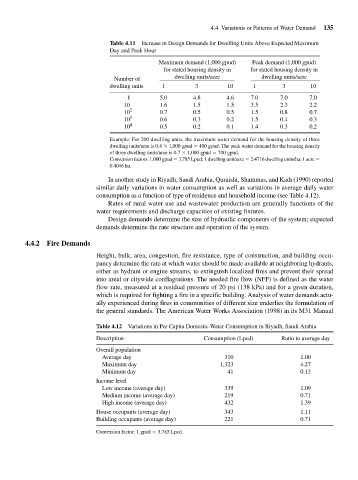
Table 4.11 Increase in Design Demands for Dwelling Units Above Expected Maximum
Day and Peak Hour
Maximum demand (1,000 gpud) Peak demand (1,000 gpud)
for stated housing density in for stated housing density in
Number of dwelling units/acre dwelling units/acre
dwelling units 1 3 10 1 3 10
1 5.0 4.8 4.6 7.0 7.0 7.0
10 1.6 1.5 1.5 3.5 2.3 2.2
10 2 0.7 0.5 0.5 1.5 0.8 0.7
10 3 0.6 0.3 0.2 1.5 0.4 0.3
10 4 0.5 0.2 0.1 1.4 0.3 0.2
Example: For 200 dwelling units, the maximum water demand for the housing density of three
dwelling units/acre is 0.4 1,000 gpud 400 gpud. The peak water demand for the housing density
of three dwelling units/acre is 0.7 1,000 gpud 700 gpud.
Conversion factors:1,000 gpud 3,785 Lpud; 1 dwelling unit/acre 2.4716 dwelling units/ha; 1 acre
0.4046 ha.
In another study in Riyadh, Saudi Arabia, Quraishi, Shammas, and Kadi (1990) reported
similar daily variations in water consumption as well as variations in average daily water
consumption as a function of type of residence and household income (see Table 4.12).
Rates of rural water use and wastewater production are generally functions of the
water requirements and discharge capacities of existing fixtures.
Design demands determine the size of hydraulic components of the system; expected
demands determine the rate structure and operation of the system.
4.4.2 Fire Demands
Height, bulk, area, congestion, fire resistance, type of construction, and building occu-
pancy determine the rate at which water should be made available at neighboring hydrants,
either as hydrant or engine streams, to extinguish localized fires and prevent their spread
into areal or citywide conflagrations. The needed fire flow (NFF) is defined as the water
flow rate, measured at a residual pressure of 20 psi (138 kPa) and for a given duration,
which is required for fighting a fire in a specific building. Analysis of water demands actu-
ally experienced during fires in communities of different size underlies the formulation of
the general standards. The American Water Works Association (1998) in its M31 Manual
Table 4.12 Variations in Per Capita Domestic Water Consumption in Riyadh, Saudi Arabia
Description Consumption (Lpcd) Ratio to average day
Overall population
Average day 310 1.00
Maximum day 1,323 4.27
Minimum day 41 0.13
Income level
Low income (average day) 339 1.09
Medium income (average day) 219 0.71
High income (average day) 432 1.39
House occupants (average day) 343 1.11
Building occupants (average day) 221 0.71
Conversion factor: 1 gpcd 3.785 Lpcd.