
Page 172 - Fair, Geyer, and Okun's Water and wastewater engineering : water supply and wastewater removal
P. 172
JWCL344_ch04_118-153.qxd 8/17/10 3:53 PM Page 134
134 Chapter 4 Quantities of Water and Wastewater Flows
Where existing water quantity data are not available to accurately determine the in-
stantaneous peak demand for the design year, the following criteria may be used as a min-
imum for estimating the instantaneous peak demand:
For 220 people or less: Q ins peak 9(Q avg day )
For more than 220 people: Q ins peak 7(Q avg day )>P k 0.167
where
Q ins peak instantaneous peak water demand (gpm or L/min)
Q avg day average daily water demand (gpm or L/min)
P k design year population (thousands)
4.4.1 Domestic Variations
Observations in a Johns Hopkins University study and standards of the Federal Housing
Administration for domestic drafts are brought together in Table 4.10. Damping effects pro-
duced by network size and phasing of commercial, industrial, and domestic drafts explain the
differences between community-wide and domestic demands. Observational values for peak
hourly demands Q peak h in gpud for U.S. customary units and Lpud for SI units are given by
the regression equation:
Q peak h 334 2.02 Q max day (U.S. Customary Units) (4.21)
Q peak h 1264 2.02 Q max day (SI Units) (4.21a)
where Q max day is the maximum daily water demand in gpud for U.S. customary units and
Lpud for SI units.
Calculation of the confidence limit of expected demands makes it possible to attach
suitably higher limits to these values. For design this may be the 95% confidence limit,
2
which lies above the expected rate of demand by twice the variance, that is, by 2 where
is the standard deviation of the observed demands. Approximate values of this variance
are shown in Table 4.11 for gross housing densities of 1, 3, and 10 dwelling units per acre
(1 acre 0.4046 ha) and a potential daily evapotranspiration of 0.28 in. (7.1 mm) of water.
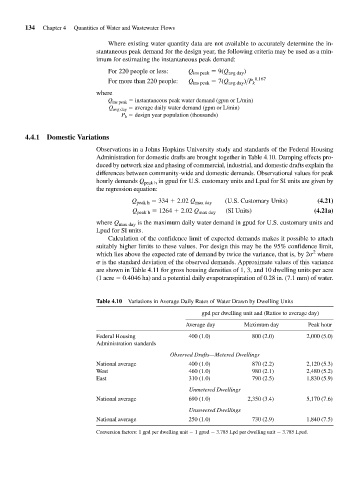
Table 4.10 Variations in Average Daily Rates of Water Drawn by Dwelling Units
gpd per dwelling unit and (Ratios to average day)
Average day Maximum day Peak hour
Federal Housing 400 (1.0) 800 (2.0) 2,000 (5.0)
Administration standards
Observed Drafts—Metered Dwellings
National average 400 (1.0) 870 (2.2) 2,120 (5.3)
West 460 (1.0) 980 (2.1) 2,480 (5.2)
East 310 (1.0) 790 (2.5) 1,830 (5.9)
Unmetered Dwellings
National average 690 (1.0) 2,350 (3.4) 5,170 (7.6)
Unsewered Dwellings
National average 250 (1.0) 730 (2.9) 1,840 (7.5)
Conversion factors: 1 gpd per dwelling unit 1 gpud 3.785 Lpd per dwelling unit 3.785 Lpud.