
Page 167 - Fair, Geyer, and Okun's Water and wastewater engineering : water supply and wastewater removal
P. 167
JWCL344_ch04_118-153.qxd 8/2/10 9:18 PM Page 129
4.3 Water Consumption 129
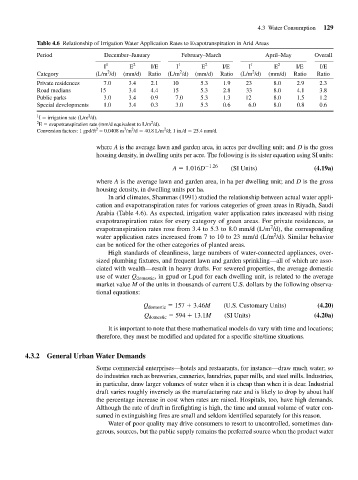
Table 4.6 Relationship of Irrigation Water Application Rates to Evapotranspiration in Arid Areas
Period December–January February–March April–May Overall
I 1 E 2 I/E I 1 E 2 I/E I 1 E 2 I/E I/E
2
2
2
Category (L/m /d) (mm/d) Ratio (L/m /d) (mm/d) Ratio (L/m /d) (mm/d) Ratio Ratio
Private residences 7.0 3.4 2.1 10 5.3 1.9 23 8.0 2.9 2.3
Road medians 15 3.4 4.4 15 5.3 2.8 33 8.0 4.1 3.8
Public parks 3.0 3.4 0.9 7.0 5.3 1.3 12 8.0 1.5 1.2
Special developments 1.0 3.4 0.3 3.0 5.3 0.6 6.0 8.0 0.8 0.6
2
1 I irrigation rate (L/m /d).
2 E evapotranspiration rate (mm/d equivalent to L/m /d).
2
2
2
2
3
Conversion factors: 1 gpd/ft 0.0408 m /m /d 40.8 L/m /d; 1 in./d 25.4 mm/d.
where A is the average lawn and garden area, in acres per dwelling unit; and D is the gross
housing density, in dwelling units per acre. The following is its sister equation using SI units:
A 1.016D 1.26 (SI Units) (4.19a)
where A is the average lawn and garden area, in ha per dwelling unit; and D is the gross
housing density, in dwelling units per ha.
In arid climates, Shammas (1991) studied the relationship between actual water appli-
cation and evapotranspiration rates for various categories of green areas in Riyadh, Saudi
Arabia (Table 4.6). As expected, irrigation water application rates increased with rising
evapotranspiration rates for every category of green areas. For private residences, as
2
evapotranspiration rates rose from 3.4 to 5.3 to 8.0 mm/d (L/m /d), the corresponding
2
water application rates increased from 7 to 10 to 23 mm/d (L/m /d). Similar behavior
can be noticed for the other categories of planted areas.
High standards of cleanliness, large numbers of water-connected appliances, over-
sized plumbing fixtures, and frequent lawn and garden sprinkling—all of which are asso-
ciated with wealth—result in heavy drafts. For sewered properties, the average domestic
use of water Q domestic , in gpud or Lpud for each dwelling unit, is related to the average
market value M of the units in thousands of current U.S. dollars by the following observa-
tional equations:
Q domestic 157 3.46M (U.S. Customary Units) (4.20)
Q domestic 594 13.1M (SI Units) (4.20a)
It is important to note that these mathematical models do vary with time and locations;
therefore, they must be modified and updated for a specific site/time situations.
4.3.2 General Urban Water Demands
Some commercial enterprises—hotels and restaurants, for instance—draw much water; so
do industries such as breweries, canneries, laundries, paper mills, and steel mills. Industries,
in particular, draw larger volumes of water when it is cheap than when it is dear. Industrial
draft varies roughly inversely as the manufacturing rate and is likely to drop by about half
the percentage increase in cost when rates are raised. Hospitals, too, have high demands.
Although the rate of draft in firefighting is high, the time and annual volume of water con-
sumed in extinguishing fires are small and seldom identified separately for this reason.
Water of poor quality may drive consumers to resort to uncontrolled, sometimes dan-
gerous, sources, but the public supply remains the preferred source when the product water