
Page 162 - Fair, Geyer, and Okun's Water and wastewater engineering : water supply and wastewater removal
P. 162
JWCL344_ch04_118-153.qxd 8/2/10 9:18 PM Page 124
124 Chapter 4 Quantities of Water and Wastewater Flows
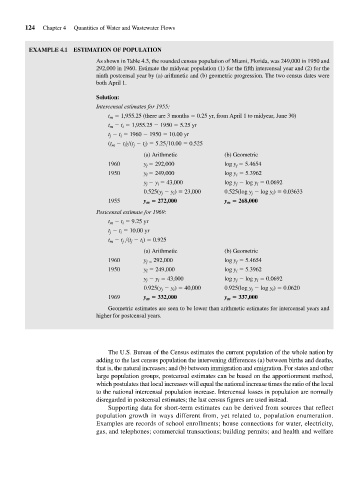
EXAMPLE 4.1 ESTIMATION OF POPULATION
As shown in Table 4.3, the rounded census population of Miami, Florida, was 249,000 in 1950 and
292,000 in 1960. Estimate the midyear population (1) for the fifth intercensal year and (2) for the
ninth postcensal year by (a) arithmetic and (b) geometric progression. The two census dates were
both April 1.
Solution:
Intercensal estimates for 1955:
t m 1,955.25 (there are 3 months 0.25 yr, from April 1 to midyear, June 30)
t m t i 1,955.25 1950 5.25 yr
t j t i 1960 1950 10.00 yr
(t m t i )>(t j t i ) 5.25>10.00 0.525
(a) Arithmetic (b) Geometric
1960 y j 292,000 log y j 5.4654
1950 y i 249,000 log y i 5.3962
y j y i 43,000 log y j log y i 0.0692
0.525(y j y i ) 23,000 0.525(log y j log y i ) 0.03633
1955 y m 272,000 y m 268,000
Postcensal estimate for 1969:
t m t i 9.25 yr
t j t i 10.00 yr
t m t j >(t j t i ) 0.925
(a) Arithmetic (b) Geometric
1960 y j 292,000 log y j 5.4654
1950 y i 249,000 log y i 5.3962
y j y i 43,000 log y j log y i 0.0692
0.925(y j y i ) 40,000 0.925(log y j log y i ) 0.0620
1969 y m 332,000 y m 337,000
Geometric estimates are seen to be lower than arithmetic estimates for intercensal years and
higher for postcensal years.
The U.S. Bureau of the Census estimates the current population of the whole nation by
adding to the last census population the intervening differences (a) between births and deaths,
that is, the natural increases; and (b) between immigration and emigration. For states and other
large population groups, postcensal estimates can be based on the apportionment method,
which postulates that local increases will equal the national increase times the ratio of the local
to the national intercensal population increase. Intercensal losses in population are normally
disregarded in postcensal estimates; the last census figures are used instead.
Supporting data for short-term estimates can be derived from sources that reflect
population growth in ways different from, yet related to, population enumeration.
Examples are records of school enrollments; house connections for water, electricity,
gas, and telephones; commercial transactions; building permits; and health and welfare