
Page 159 - Fair, Geyer, and Okun's Water and wastewater engineering : water supply and wastewater removal
P. 159
JWCL344_ch04_118-153.qxd 8/2/10 9:18 PM Page 121
4.2 Design Population 121
Table 4.3 Census Populations of Detroit, MI, Providence, RI, and Miami,
FL, 1910–2006
City
Census Year Detroit Providence Miami
1910 466,000 224,000 5,500
1920 994,000 235,000 30,000
1930 1,569,000 253,000 111,000
1940 1,623,000 254,000 172,000
1950 1,850,000 249,000 249,000
1960 1,670,000 207,000 292,000
1970 1,493,000 177,000 332,000
1980 1,203,000 157,000 347,000
1990 1,028,000 161,000 359,000
2000 951,000 174,000 363,000
2006 (Estimated) 871,000 175,000 404,000
All population values have been rounded to the nearest thousand.
Source: After U.S. Bureau of the Census.
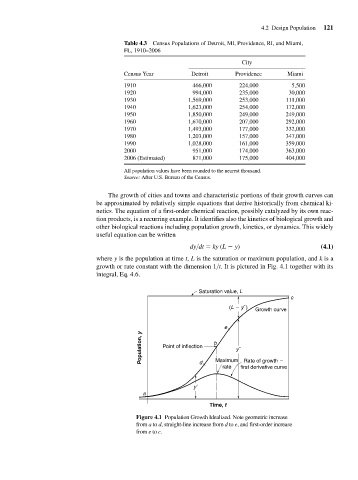
The growth of cities and towns and characteristic portions of their growth curves can
be approximated by relatively simple equations that derive historically from chemical ki-
netics. The equation of a first-order chemical reaction, possibly catalyzed by its own reac-
tion products, is a recurring example. It identifies also the kinetics of biological growth and
other biological reactions including population growth, kinetics, or dynamics. This widely
useful equation can be written
dy>dt ky (L y) (4.1)
where y is the population at time t, L is the saturation or maximum population, and k is a
growth or rate constant with the dimension 1>t. It is pictured in Fig. 4.1 together with its
integral, Eq. 4.6.
Saturation value, L
c
(L y˝) Growth curve
e
Population, y Point of inflection b y˝
Maximum
Rate of growth
d
rate first derivative curve
y´
a
Time, t
Figure 4.1 Population Growth Idealized. Note geometric increase
from a to d, straight-line increase from d to e, and first-order increase
from e to c.